---
title: Java agent configuration: Config file
source: https://docs.newrelic.com/docs/apm/agents/java-agent/configuration/java-agent-configuration-config-file
---
The New Relic Java agent reads its configuration from the `newrelic.yml` file. By default the agent looks for this file in the [directory](https://docs.newrelic.com/docs/agents/manage-apm-agents/troubleshooting/find-agent-root-directory#java-agent) that contains `newrelic.jar`. You can override the config file's location by setting the [`newrelic.config.file`](#newrelic-config-file) system property to a fully qualified file name.
You'll be able to configure our Java agent to suit your environment after you [create a New Relic account](https://newrelic.com/signup) (it's free, forever) and [install the Java agent](https://docs.newrelic.com/docs/apm/agents/java-agent/installation/install-java-agent/).
## Configuration file structure [#Structure]
The `newrelic.yml` file has separate sections for different environments:
- Test
- Development
- Staging
- Production (default)
New Relic applies settings in the `common` section to each of these environments. You can select other environments as the default by setting the [`newrelic.environment`](#newrelic-environment) system property to the environment name.
> #### 💡 TIP
>
> A [`newrelic.yml` template](https://docs.newrelic.com/docs/java/java-agent-config-file-template) is available.
If you edit `newrelic.yml`, be careful to conform to the [YAML format](https://en.wikipedia.org/wiki/YAML). Use a YAML validator to ensure the syntax is accurate before using the file with New Relic's Java agent, and follow these rules:
| **Java agent newrelic.yml** | **Requirements** |
| --------------------------- | -------------------------------------------------------------------------------------------------------------------------------------------------------------------------------------------------------------------------------------------------------------------------------------------------- |
| Format | YML files are case sensitive. |
| Indentations | All indentations must be in increments of two characters. Other indentations will result in an `Unable to parse configuration file` error upon agent startup. - Use the same level of indentation for data in the same section of the file. - Indent any sub-sections by an additional two spaces. |
| Changes to file | You must restart your JVM host process for changes to take effect. **Exception:** Property changes to `log_level` and `audit_mode` do not require a restart. Property changes under circuit breaker don't require a restart. |
## Configuration settings precedence [#config-options-precedence]
To override any setting in the config file, use a [system property override](#System_Properties). In certain environments, [environment variables](#Environment_Variables) can also be used to override both the config file and the system properties. The environment variables primarily exist to support Heroku. When used, [server-side configuration](https://docs.newrelic.com/docs/agents/manage-apm-agents/configuration/server-side-agent-configuration) overrides all other configuration settings.
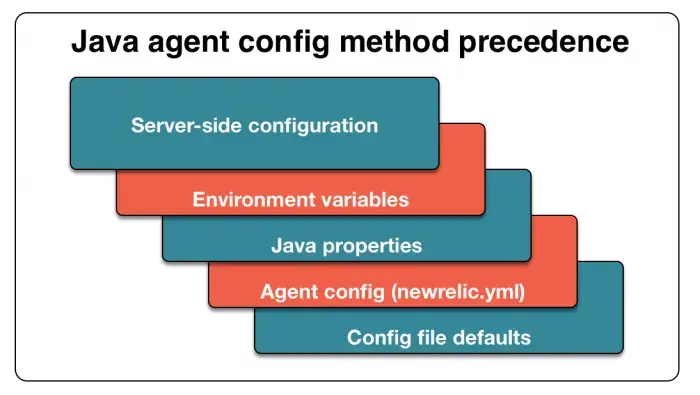
With the Java agent, server-side configuration overrides all other settings. Environment variables override Java system properties. Java properties override user configuration settings in your `newrelic.yml` file. User settings override the `newrelic.yml` default settings.
## Configuring the Java extensions directory [#extensions-directory]
The Java agent reads the configuration files on process startup. To identify the directory where the files are located, either create a new or specify an existing extensions directory:
**Create an extensions directory**
To create the extensions directory:
1. Navigate to the directory where `newrelic.jar` and `newrelic.yml` are located. Create a directory named `extensions`.
2. In `newrelic.yml`, check that the property [`extensions.dir`](#cfg-extensions-dir) is not set.
**Specify an existing extensions directory**
To use an existing Java extensions directory:
1. In your `newrelic.yml` file, locate the `common` section.
2. Use the property [`extensions.dir`](#cfg-extensions-dir) to specify the location of the file.
## General configuration settings [#General]
Set these options in the `common` section. To [override](#System_Properties) any of these options, use a `newrelic.config` prefixed system property.
**license_key (REQUIRED)**
| Type | String |
| ------- | ------ |
| Default | (none) |
This setting is **required**. You must specify the [license key](https://docs.newrelic.com/docs/apis/intro-apis/new-relic-api-keys/#ingest-license-key) associated with your New Relic account. This key binds your agent's data to your account in the New Relic service.
**app_name (REQUIRED)**
| Type | String |
| ------- | ------ |
| Default | (none) |
This setting is **required**. Defines the [application name](https://docs.newrelic.com/docs/site/naming-your-application) used to report data to New Relic.
If [`enable_auto_app_naming`](#cfg-enable_auto_app_naming) is false, the agent reports all data to this application. Otherwise, the agent reports only background tasks (transactions for non-web applications) to this application.
To report data to [more than one application](https://docs.newrelic.com/docs/java/multiple-application-names), separate the application names with a semicolon. For example, to report data to **My Application** and **My Application 2** use this:
````yml
app_name: My Application;My Application 2
```
For more methods of naming your application, see [Name your Java application](/docs/agents/java-agent/configuration/name-your-java-application).
````
**agent_enabled**
| Type | Boolean |
| ------- | ------- |
| Default | `true` |
Flag to enable the agent. Use this setting to force the agent to run or not run.
**apdex_t (DEPRECATED)**
| Type | Float |
| ------- | ----- |
| Default | `1.0` |
The `apdex_t` threshold in seconds for the application's [Apdex](https://docs.newrelic.com/docs/site/apdex-measuring-user-satisfaction) score. For Java agent versions 1.2.008 or higher, the `apdex_t` value is set in the UI and the value in `newrelic.yml` is ignored.
**appserver_port**
| Type | Integer |
| ------- | ------- |
| Default | (none) |
Number to differentiate JVMs for the same app on the same machine. New Relic [uses host/port for uniqueness](https://docs.newrelic.com/docs/agents/java-agent/configuration/hostname-logic-java#unique-identifier), so you can distinguish the JVMs by putting a switch like this into the startup arguments for each JVM:
````ini
-Dnewrelic.config.appserver_port=8081
```
Once you have used `appserver_port` to name the JVMs and restart them, you should be able to see them individually in the dropdown and in the profiling interface.
This is only a change for New Relic; it doesn't actually affect the port on which the host communicates in any way.
````
**audit_mode**
| Type | Boolean |
| ------- | ------- |
| Default | `false` |
Enables plain text logging of all data sent to New Relic to the agent logfile. This setting is dynamic, so running agents will notice changes to `newrelic.yml` without a JVM restart.
**ca_bundle_path**
| Type | String |
| ------------ | ----------------------------- |
| Value Format | `/path/to/ca/cert/bundle.pem` |
Specifies a path to a custom SSL certificate bundle that will be used by the agent to establish a secure connection to New Relic. If your custom SSL certificate bundle doesn't include certificates that are sufficient to connect to New Relic then you'll need to [merge the required certs into your custom certificate bundle](https://docs.newrelic.com/docs/agents/java-agent/troubleshooting/ssl-or-connection-errors-java).
> #### ⚠️ IMPORTANT
>
> Our implementation of the Java Flight Recorder that is currently bundled with the Java agent uses the Telemetry SDK. Specifying a ca_bundle_path will not update the certificate our JFR option uses to connect to New Relic. If you are using a custom truststore and would like to use the Java agent JFR implementation, then you'll need to add the required certs into your custom truststore.
**datastore_multihost_preference**
| Type | String |
| ------- | ------ |
| Default | `NONE` |
If multiple addresses are detected during the connect cycle for a data store, this setting determines which address the agent will choose:
- `NONE`: The agent returns an empty address. This is the default behavior.
- `FIRST`: Use the first address detected.
- `LAST`: Use the last address detected.
This config exists in Java agent version 8.25.0+.
**enable_auto_app_naming**
| Type | Boolean |
| ------- | ------- |
| Default | `false` |
Enables the reporting of data separately for each web app. Set to `true` to enable support for auto app naming. The name of each web app is detected automatically and the agent reports data separately for each one. This provides a finer-grained performance breakdown for web apps in New Relic.
For more information, see [Automatic application naming](https://docs.newrelic.com/docs/agents/java-agent/configuration/automatic-application-naming).
For more methods of naming your application, see [Name your Java application](https://docs.newrelic.com/docs/agents/java-agent/configuration/name-your-java-application).
**enable_auto_transaction_naming**
| Type | Boolean |
| ------- | ------- |
| Default | `true` |
Enables component-based transaction naming. Set to `true` to enable component-based transaction naming. Set to `false` to use the URI of a web request as the name of the transaction. For more information, see [Naming web transactions](https://docs.newrelic.com/docs/agents/java-agent/instrumentation/naming-web-transactions).
> #### ⚠️ CAUTION
>
> Unless you implement API calls to name your transactions, disabling auto-transaction naming is very likely to cause [Metric grouping issues](https://docs.newrelic.com/docs/features/metric-grouping-issues).
**enable_custom_tracing**
| Type | Boolean |
| ------- | ------- |
| Default | `true` |
Enables all instrumentation [using an `@Trace` annotation](https://docs.newrelic.com/docs/agents/java-agent/custom-instrumentation/java-instrumentation-annotation). Disabling this causes `@Trace` annotations to be ignored.
**event_ingest_uri**
| Type | String |
| ------- | -------------------------------------------------------------------------------------------------------------------------- |
| Default | [`https://insights-collector.newrelic.com/v1/accounts/events`](https://insights-collector.newrelic.com/v1/accounts/events) |
Event ingest URI used by some agent features. Defaults to the US production ingest endpoint. Can be manually configured to send events to other ingest endpoints. Examples:
- EU: `https://insights-collector.eu01.nr-data.net/v1/accounts/events`
- JP: `https://insights-collector.jp.nr-data.net/v1/accounts/events`
FedRAMP compliant customers should use the [FedRAMP compliant endpoint](https://docs.newrelic.com/docs/security/security-privacy/compliance/fedramp-compliant-endpoints/#event-api): `https://gov-insights-collector.newrelic.com/v1/accounts/events`
**extensions.dir**
| Type | String |
| ------- | ------ |
| Default | (none) |
Defines the location of the optional [extensions directory](#extensions-directory). If this property is not set, the agent will look for a subdirectory named `extensions` in the same directory as `newrelic.jar` and `newrelic.yml`.
**high_security**
| Type | Boolean |
| ------- | ------- |
| Default | `false` |
In order for [high security](https://docs.newrelic.com/docs/subscriptions/high-security) to be enabled, this property must be set to `true` and the high security property in the New Relic user interface must be enabled. Enabling high security means SSL is turned on, request and message queue parameters are not collected, and queries cannot be sent to New Relic in their raw form.
> #### ⚠️ IMPORTANT
>
> As of [Java agent 3.48.0](https://docs.newrelic.com/docs/release-notes/agent-release-notes/java-release-notes/java-agent-3480), SSL is enabled by default and the config option to disable it has been deprecated. As of [Java agent 4.0.0](https://docs.newrelic.com/docs/release-notes/agent-release-notes/java-release-notes/java-agent-400), the ability to disable SSL has been removed.
**host**
| Type | String |
| ------- | ------ |
| Default | (none) |
Provides the ability to configure a [FedRAMP compliant endpoint](https://docs.newrelic.com/docs/security/security-privacy/compliance/fedramp-compliant-endpoints/) for the agent to use, with the value `gov-collector.newrelic.com`.
**insert_api_key**
| Type | String |
| ------- | ------ |
| Default | (none) |
A valid [Insert API Key](https://docs.newrelic.com/docs/apis/get-started/intro-apis/types-new-relic-api-keys#event-insert-key) for your account. This is not currently used by the agent.
**labels**
| Type | String |
| ------- | ------ |
| Default | `""` |
Attach [tags](https://docs.newrelic.com/docs/apm/new-relic-apm/maintenance/labels-categories-organize-your-apps-servers) to this app.
Note that this option now enables tags, which replaced the label feature. You can still query your historical [labels](https://docs.newrelic.com/docs/new-relic-one/use-new-relic-one/core-concepts/tagging-use-tags-organize-group-what-you-monitor#labels). Multiple tags can be attached by using a semicolon as a separator as follows:
````ini
-Dnewrelic.config.labels="tagName1:tagValue1;tagName2:tagValue2;tagName3:tagValue3"
```
````
**legacy_async_api_skip_suspend**
| Type | Boolean |
| ------- | ------- |
| Default | False |
In rare cases, a memory leak could occur with instrumentation that uses the legacy async API to track the lifecycle
of async servlets or Jetty Continuations. The memory leak would manifest as leaked transactions that were suspended
but never resumed. This configuration acts as a workaround to prevent such a scenario from occurring. It is
advised to only enable this workaround when encountering such a memory leak.
**max_stack_trace_lines**
| Type | Integer |
| ------- | ------- |
| Default | `30` |
Limits the number of lines the agent collects from each stack trace. Increasing this value may impact performance, because it increases the amount of memory the agent uses and the amount of data sent to New Relic.
**metric_ingest_uri**
| Type | String |
| ------- | ---------------------------------------------------------------------------------------- |
| Default | [`https://metric-api.newrelic.com/metric/v1`](https://metric-api.newrelic.com/metric/v1) |
Metric ingest URI used by some agent features. Defaults to the US production ingest endpoint. Can be manually configured to send metrics to other ingest endpoints. Examples:
- EU: `https://metric-api.eu.newrelic.com/metric/v1`
- JP: `https://metric-api.jp.nr-data.net/metric/v1`
FedRAMP compliant customers should use the [FedRAMP compliant endpoint](https://docs.newrelic.com/docs/security/security-privacy/compliance/fedramp-compliant-endpoints/#metric-api): `https://gov-metric-api.newrelic.com/metric/v1`
**proxy_host**
| Type | String |
| ------- | ------ |
| Default | (none) |
The proxy host through which to connect to the [New Relic collector](https://docs.newrelic.com/docs/accounts-partnerships/education/getting-started-new-relic/glossary#collector). If a proxy is used, the host setting is required. Other proxy settings are optional.
**proxy_password**
| Type | String |
| ------- | ------ |
| Default | (none) |
The password for proxy authentication. If a proxy is used, the host setting is required. Other proxy settings are optional. The username and password settings will be used to authenticate to Basic Auth challenges from a proxy server.
> #### ⚠️ IMPORTANT
>
> The Java agent supports Basic (clear text) authentication.
**proxy_port**
| Type | String |
| ------- | ------ |
| Default | `8080` |
The proxy host port number. If a proxy is used, the host setting is required. Other proxy settings are optional.
**proxy_user**
| Type | String |
| ------- | ------ |
| Default | (none) |
The username for proxy authentication, such as Basic (clear text) authentication. If a proxy is used, the host setting is required. Other proxy settings are optional. The username and password settings will be used to authenticate to Basic Auth challenges from a proxy server.
**proxy_scheme**
| Type | String |
| ------- | ------ |
| Default | (none) |
The proxy scheme used. Setting `proxy_scheme: "https"` will allow the agent to connect through proxies using the HTTPS scheme.
**reactor-netty.errors.enabled**
| Type | Boolean |
| ------- | ------- |
| Default | `false` |
Whether errors are reported for Reactor Netty. Default is false. If set to true, Reactor Netty errors will be reported.
> #### ⚠️ IMPORTANT
>
> Only available in [Java agent 6.3.0](https://docs.newrelic.com/docs/release-notes/agent-release-notes/java-release-notes/java-agent-630) and above.
>
> Notice, default was changed to false as of Java agent 6.5.0.
**send_data_on_exit**
| Type | Boolean |
| ------- | ------- |
| Default | `false` |
Enable delayed JVM shutdown to give the agent a chance to send latest metric data to New Relic before JVM shutdown.
**send_data_on_exit_threshold**
| Type | Integer |
| ------- | ------- |
| Default | `60` |
The number of seconds after which the agent will use the [`send_data_on_exit`](#cfg-send_data_on_exit) setting.
**send_environment_info**
| Type | Boolean |
| ------- | ------- |
| Default | `true` |
Enable reporting of JVM settings to New Relic.
**send_jvm_props**
| Type | Boolean |
| ------- | ------- |
| Default | `true` |
When set to `true`, JVM properties will be sent to New Relic.
**ssl (DEPRECATED)**
| Type | Boolean |
| ------- | ------- |
| Default | `true` |
Requires connections to the New Relic collector to go over SSL.
The agent communicates with New Relic via HTTPS by default, and New Relic [requires HTTPS](https://docs.newrelic.com/docs/apis/rest-api-v2/troubleshooting/301-response-rest-api-calls) for all traffic to APM and the New Relic REST API.
This work is done asynchronously to the threads that process your application code, so response times will not be directly affected by this change.
> #### ⚠️ IMPORTANT
>
> As of [Java agent 3.48.0](https://docs.newrelic.com/docs/release-notes/agent-release-notes/java-release-notes/java-agent-3480), SSL is enabled by default and the config option to disable it has been deprecated. As of [Java agent 4.0.0](https://docs.newrelic.com/docs/release-notes/agent-release-notes/java-release-notes/java-agent-400), the ability to disable SSL has been removed.
**sync_startup**
| Type | Boolean |
| ------- | ------- |
| Default | `false` |
Enable the agent to connect the New Relic collector immediately upon app startup.
**scala_futures_as_segments**
> #### ⚠️ IMPORTANT
>
> This applies to Java agent [version 3.44.0 or higher](https://docs.newrelic.com/docs/release-notes/agent-release-notes/java-release-notes).
| Type | Boolean |
| ------- | ------- |
| Default | `false` |
For more concise transaction trace details, the agent does not report Scala Futures as transaction segments, and those Futures do not contribute to the [transaction’s total time](https://docs.newrelic.com/docs/data-analysis/user-interface-functions/view-your-data/response-time#response-time-total-time).
Enabling `scala_futures_as_segments` increases your overhead. If you want Scala Futures to report as transaction segments so you can view them in a transaction trace, you can enable it:
````yml
scala_futures_as_segments:
enabled: true
```
````
**trim_stats**
| Type | Boolean |
| ------- | ------- |
| Default | `true` |
When the exclusive time of a segment is less than 2% of the total transaction time, the metric for that method call will be aggregated under `Java/other`.
Setting `trim_stats` to `false` will disable this behavior, allowing metrics to be individually displayed.
````yml
trim_stats: false
```
````
## Environment variables [#Environment_Variables]
Environment variables take the highest precedence and override the system properties and yml config settings.
- To set environment variables, use the `export VARNAME=value` command.
- To permanently set environment variables, add the export line to a file such as `~/.bashrc` or `~/.bash_profile`.
You can override any setting from a system property or in the `newrelic.yml` by setting an environment variable. The environment variable corresponding to a given setting in the config file is the setting name prefixed by `NEW_RELIC` with all dots (`.`) and dashes (`-`) replaced by underscores (`_`). For example, the environment variable for the `log_level` setting is `NEW_RELIC_LOG_LEVEL`.
For settings nested in sections, prepend the section name to the setting name. For example:
```yml
class_transformer:
com.newrelic.instrumentation.kafka-clients-spans-0.11.0.0:
enabled: true
```
The configuration above would convert to the following environment variable: `NEW_RELIC_CLASS_TRANSFORMER_COM_NEWRELIC_INSTRUMENTATION_KAFKA_CLIENTS_SPANS_0_11_0_0_ENABLED`
> #### ⚠️ IMPORTANT
>
> Agent configuration via environment variables requires [Java agent version 4.10.0 or higher](https://docs.newrelic.com/docs/agents/java-agent/installation/upgrade-java-agent).
## System properties [#System_Properties]
You can override any setting in the `newrelic.yml` file by setting a system property. The system property corresponding to a given setting in the config file is the setting name prefixed by `newrelic.config`. For example, the system property for the `log_level` setting is `newrelic.config.log_level`.
For settings nested in sections, prepend the section name to the setting name. For example, the system property for the `enabled` setting in the transaction_tracer section is `newrelic.config.transaction_tracer.enabled`.
In addition to overriding configuration settings, the agent recognizes these system properties:
**com.newrelic.jboss.jsr77.fix**
| Type | Boolean |
| ------- | ------- |
| Default | (none) |
Starting from agent version `8.7.0`, if set to true and the Agent is running with JBoss EAP / Wildfly,
this will prevent the agent from requiring any class under the package `javax.management` to be loaded by the system classloader.
This is added to help fix application startup issues with JBoss Modules when the J2EE/Jakarta Management API is used.
More information is provided in the JBoss / Wildfly [troubleshooting doc](https://docs.newrelic.com/docs/apm/agents/java-agent/troubleshooting/classloading-issues-from-jboss-and-wildfly).
**newrelic.config.experimental_runtime**
| Type | Boolean |
| ------- | ------- |
| Default | (none) |
Expiramental flag that allows the agent to run with unsupported java versions.
**newrelic.config.process_host.display_name**
| Type | String |
| ------- | ------ |
| Default | (none) |
Set a [display name](https://docs.newrelic.com/docs/agents/java-agent/configuration/hostname-logic-java#display-name) to decorate the "host:port" label in the New Relic UI. Requires Java agent 3.17 or higher.
**newrelic.config.file**
| Type | String |
| ------- | ------ |
| Default | (none) |
String containing a fully qualified path to the newrelic configuration file. If empty, the agent assumes `newrelic.yml` is in the same directory as `newrelic.jar`.
**newrelic.debug**
| Type | Boolean |
| ------- | ------- |
| Default | (none) |
Enable debug logging.
**newrelic.environment**
| Type | String |
| ------- | ------ |
| Default | (none) |
String containing the environment configuration for the agent to use.
**newrelic.home**
| Type | String |
| ------- | ------ |
| Default | (none) |
String containing the home directory of agent. This defaults to the same directory as the agent jarfile.
**newrelic.logfile**
| Type | String |
| ------- | -------------------- |
| Default | `newrelic_agent.log` |
String containing the name of the agent log file.
## AI monitoring [#ai-monitoring]
This section details the Java agent configuration options for [AI monitoring](https://docs.newrelic.com/docs/ai-monitoring/intro-to-ai-monitoring). This feature can be configured in the `ai_monitoring` yaml config file stanza, with `newrelic.config.ai_monitoring.` prefixed system properties, or with `NEW_RELIC_AI_MONITORING_` prefixed environment variables.
> #### ⚠️ IMPORTANT
>
> If distributed tracing is disabled or high security mode is enabled, AI monitoring will not collect AI data.
> #### ⚠️ IMPORTANT
>
> When enabled, AI monitoring records a streaming copy of inputs and outputs sent to and from the models you choose to monitor, including any personal information contained therein.
> You're responsible for obtaining consent from your model users that their interactions may be recorded by a third party (New Relic) for the purpose of providing the AI monitoring feature.
**enabled**
| Type | Boolean |
| ------- | ------- |
| Default | `false` |
When set to `true`, enables AI monitoring.
**record_content.enabled**
| Type | Boolean |
| ------- | ------- |
| Default | `true` |
If set to `false`, agent will omit input and output content (like text strings from prompts and responses) captured in LLM events. This is an optional security setting if you don’t want to record sensitive data sent to and received from your LLMs.
## Attributes [#attributes]
To set these options, use the `attributes` section. To [override](#System_Properties) them, use a `newrelic.config.attributes` prefixed system property.
Attributes are key-value pairs related to transaction traces, traced errors, browser monitoring, and transaction events. There's an `attribute` section under each destination. For more information, see [Java agent attributes](https://docs.newrelic.com/docs/java/java-agent-attributes), [Enabling and disabling attributes](https://docs.newrelic.com/docs/java/enabling-and-disabling-attributes) and [Attribute examples](https://docs.newrelic.com/docs/java/attribute-examples).
**enabled**
| Type | Boolean |
| ------- | ------- |
| Default | `true` |
This setting can be used to turn on or off all attributes.
For security reasons, capturing custom attributes using the Custom Instrumentation Editor is set to false by default.
**include**
| Type | List of Strings |
| ------- | --------------- |
| Default | (none) |
If attributes are enabled, attribute keys found in this list will be sent to New Relic. Separate the keys in the list with a comma; for example:
````
key1, key2, key3
```
Also refer to the [agent attribute rules](/docs/subscriptions/agent-attributes).
````
**exclude**
| Type | List of Strings |
| ------- | --------------- |
| Default | (none) |
All attribute keys found in this list will not be sent to New Relic. Separate the keys in the list with a comma; for example:
````
key1, key2, key3
```
Also refer to the [agent attribute rules](/docs/subscriptions/agent-attributes).
````
**http_attribute_mode**
| Type | String |
| ------- | ------ |
| Default | both |
Attribute reporting is configurable via the following means.
YAML:
````yml
attributes:
http_attribute_mode: both
```
System property:
```properties
-Dnewrelic.config.attributes.http_attribute_mode=both
```
Environment variable:
```properties
NEW_RELIC_ATTRIBUTES_HTTP_ATTRIBUTE_MODE=both
```
The configuration options are:
* `standard` : Reporting will utilize standard (i.e. OTEL) Attributes. This configuration is encouraged. It will minimize impact to functionality and maintain the lowest level of ingest for attribute reporting.
* `legacy` : Reporting will be done by the reintroduced HTTP Attributes, this configuration may impact current or future functionality.
* `both` : This is the default configuration, reporting will be done by the reintroduced HTTP Attributes and the OTEL Attributes. This configuration will also increase your data ingest.
Available since [Java agent version 8.8.0](/docs/release-notes/agent-release-notes/java-release-notes/java-agent-880). The default configuration, `both`, will increase data ingest. To avoid an increase in data ingest, you must override the default by setting `http_attribute_mode` to `legacy` or `standard`.
````
## Async instrumentation [#async_config]
These options are set directly in the `common` section and can be [overridden](#System_Properties) by using a prefixed system property.
**token_timeout**
| Type | Integer |
| ----------------- | ------- |
| Default (seconds) | `180` |
The number of seconds after which the agent will automatically expire an async token that has not been explicitly expired with `token.expire()`. For usage instructions, see [Tokens: Connect async threads](https://docs.newrelic.com/docs/agents/java-agent/java-agent-api/java-agent-api-asynchronous-applications#tokens).
> #### ⚠️ IMPORTANT
>
> Increasing this value may impact performance, because it increases the amount of memory the agent uses and prevents transactions from being reported due to unexpired tokens.
**segment_timeout**
| Type | Integer |
| ----------------- | ------- |
| Default (seconds) | `600` |
The number of seconds after which the agent will automatically end a segment that has not been explicitly ended with `segment.end()` or `segment.ignore()`. For usage instructions, see [Segments: Time arbitrary async activity](https://docs.newrelic.com/docs/agents/java-agent/java-agent-api/java-agent-api-asynchronous-applications#segments).
> #### ⚠️ IMPORTANT
>
> Increasing this value may impact performance, because it increases the amount of memory the agent uses and prevents transactions from being reported due to un-ended segments.
## Browser monitoring [#Browser_Monitoring]
These options are set in the `browser_monitoring` section and can be [overridden](#System_Properties) by using a `newrelic.config.browser_monitoring` prefixed system property.
Browser monitoring gives you insight into the performance real users are experiencing with your website. This is accomplished by measuring the time it takes for your users' browsers to download and render your web pages by injecting a small amount of JavaScript code into the header and footer of each page.
**auto_instrument**
| Type | Boolean |
| ------- | ------- |
| Default | `true` |
By default the agent automatically inserts API calls in compiled JSPs to inject the monitoring JavaScript into web pages. Set this attribute to `false` to turn off this behavior.
**disabled_auto_pages**
| Type | Comma-separated list of strings |
| ------- | ------------------------------- |
| Default | (none) |
When [`auto_instrument`](#bm-auto_instrument) is `true`, by default all pages are instrumented. List all pages that you want the auto instrumentation to skip here. You can still use manual instrumentation on these pages.
For example:
````yml
browser_monitoring:
disabled_auto_pages: /WEB-INF/jsp/testpage_1.jsp, /WEB-INF/jsp/testpage_2.jsp
```
````
**attributes.enabled**
| Type | Boolean |
| ------- | ------- |
| Default | `false` |
This setting can be used to turn on or off all attributes for browser monitoring. This is the [data you can query](https://docs.newrelic.com/docs/query-your-data/explore-query-data/explore-data/introduction-querying-new-relic-data). If `attributes.enabled` is false at the root level, no attributes will be sent up in browser monitoring regardless on how this property under `browser_monitoring` is set.
**attributes.include**
| Type | List of Strings |
| ------- | --------------- |
| Default | (none) |
If attributes are enabled for `browser_monitoring`, all attribute keys found in this list will be sent to New Relic in page views. For more information, see the [agent attribute rules](https://docs.newrelic.com/docs/apm/other-features/attributes/agent-attributes).
**attributes.exclude**
| Type | List of Strings |
| ------- | --------------- |
| Default | (none) |
All attribute keys found in this list will not be sent to New Relic in page views. For more information, see the [agent attribute rules](https://docs.newrelic.com/docs/apm/other-features/attributes/agent-attributes).
## Circuit breaker
These settings customize the behavior of the [Java circuit breaker](https://docs.newrelic.com/docs/agents/java-agent/custom-instrumentation/circuit-breaker-java-custom-instrumentation). These settings are not included in `newrelic.yml` by default. You do not need to restart your JVM after changing them.
If you want to customize the circuit breaker, add it under the `common` section:
```yml
common: &default_settings
OTHER_CONFIG_SETTINGS
circuitbreaker:
enabled: true
memory_threshold: 20
gc_cpu_threshold: 10
```
**enabled**
| Type | Boolean |
| ------- | ------- |
| Default | `true` |
If your application is behaving as expected, you may want to disable the circuit breaker.
**memory_threshold**
| Type | Integer (0 to 100) |
| ------- | ------------------ |
| Default | `20` |
Customize the percentage of free heap memory below which the circuit breaker should trip. When the percentage of free heap memory is less than `memory_threshold`, and the CPU time spent doing garbage collection is greater than `gc_cpu_threshold`, the circuit breaker trips. In order to make the circuit breaker less likely to trip, decrease `memory_threshold` and/or increase `gc_cpu_threshold`. Adjust these values as needed, based on your application's operating performance and behavior.
**gc_cpu_threshold**
| Type | Integer (0 to 100) |
| ------- | ------------------ |
| Default | `10` |
Customize the percentage of garbage collection CPU time above which the circuit breaker should trip. When the percentage of free heap memory is less than `memory_threshold`, and the CPU time spent doing garbage collection is greater than `gc_cpu_threshold`, the circuit breaker trips. In order to make the circuit breaker less likely to trip, decrease `memory_threshold` and/or increase `gc_cpu_threshold`. Adjust these values as needed, based on your application's operating performance and behavior.
## Cloud configuration
Set cloud related options, in the `cloud` section of the agent YAML. You can override these settings with a `newrelic.config.cloud` prefixed [system property](https://docs.newrelic.com/docs/apm/agents/java-agent/configuration/java-agent-configuration-config-file/#System_Properties) or a `NEW_RELIC_CLOUD_` prefixed [environment variable](https://docs.newrelic.com/docs/apm/agents/java-agent/configuration/java-agent-configuration-config-file/#Environment_Variables).
An example configuration:
```yml
cloud:
aws:
account_id: 123456789012
metadata_bypass_proxy: false
```
**aws.account_id**
| Type | String |
| ------- | ------ |
| Default | (none) |
This setting is read by some cloud service instrumentation so the `cloud.resource_id` attribute can be set in the respective spans.
AWS DynamoDB and Kinesis are services that require this value to be able to populate the `cloud.resource_id` attribute. Likewise, AWS Lambda requires that this value when the account ID is not part of the function name.
The following call will override this setting:
````java
NewRelic.getAgent().getCloud().setAccountInfo(CloudAccountInfo.AWS_ACCOUNT_ID, "...");
```
````
**metadata_bypass_proxy**
| Type | Boolean |
| ------- | ------- |
| Default | `false` |
When set to true, this setting allows you to bypass proxy for cloud metadata endpoint access. Default is false.
## Cloud platform utilization [#utilization]
Set the cloud platform utilization settings in the `utilization` section and can be overridden with the `newrelic.config.utilization` prefixed system property.
The agent collects utilization information and sends it to the New Relic service. The agent can collect information from Amazon Web Services (AWS), Azure, Google Cloud Platform, and Pivotal Cloud Foundry instances. It will also collect information related to the Docker containers and Kubernetes services.
**detect_aws**
| Type | Boolean |
| ------- | ------- |
| Default | `true` |
Determines whether the agent polls AWS metadata API.
**detect_azure**
| Type | Boolean |
| ------- | ------- |
| Default | `true` |
Determines whether the agent polls Azure metadata API.
**detect_gcp**
| Type | Boolean |
| ------- | ------- |
| Default | `true` |
Determines whether the agent polls Google Cloud Platform metadata API.
**detect_kubernetes**
| Type | Boolean |
| ------- | ------- |
| Default | `true` |
Determines whether the agent reports the `KUBERNETES_SERVICE_HOST` environment variable.
**detect_pcf**
| Type | Boolean |
| ------- | ------- |
| Default | `true` |
Determines whether the agent reads Pivotal Cloud Foundry environment variables.
**detect_docker**
| Type | Boolean |
| ------- | ------- |
| Default | `true` |
Determines whether the agent reads Docker information from the file system.
## Code-level metrics
[Code-level metrics](https://docs.newrelic.com/docs/codestream/observability/code-level-metrics) give you detailed insight into how your code is performing at the method level. You'll see metrics for each method that's been automatically instrumented, or that's been instrumented by the @Trace annotation.
Set the code-level metrics options in the `code_level_metrics` section. They can be [overridden](#System_Properties) with a `newrelic.config.code_level_metrics` prefixed system property.
**enabled**
| Type | Boolean |
| ------- | ------- |
| Default | `true` |
[Code-level metrics](https://docs.newrelic.com/docs/codestream/observability/code-level-metrics) is disabled by default in agent version 7.10.0. Set this to true to turn it on. Beginning in agent version 7.11.0 the default is, as noted above, `true`.
## Errors inbox configuration [#errors-inbox-configuration]
Setting one of the following tags will help you identify which versions of your software are producing the errors.
- `NEW_RELIC_METADATA_SERVICE_VERSION` will create `tags.service.version` on event data containing the version of your code that is deployed, in many cases a semantic version such as 1.2.3, but not always.
- `NEW_RELIC_METADATA_RELEASE_TAG ` will create `tags.releaseTag` on event data containing the release tag (such as v0.1.209 or release-209).
- `NEW_RELIC_METADATA_COMMIT` will create `tags.commit` on event data containing the commit sha. You can use the entire sha or use just the first seven characters (e.g., 734713b).
An upcoming release of errors inbox will automatically track which versions of your software are producing errors. The version data will display in [CodeStream](https://docs.newrelic.com/docs/codestream/how-use-codestream/performance-monitoring/#buildsha).
## Cross application tracer [#Cross_Application_Tracer]
> #### ⚠️ IMPORTANT
>
> Cross application tracing has been deprecated as of agent version 7.4.0 and will be removed in a future agent version.
>
> Instead of using cross application tracing, we recommend our [distributed tracing](#distributed-tracing) features. Distributed tracing is an improvement on the cross application tracing feature and is recommended for large, distributed systems.
Set the cross application tracing options in the `cross_application_tracer` section. These settings can be [overridden](#System_Properties) with a `newrelic.config.cross_application_tracer` prefixed system property.
[Cross application tracing](https://docs.newrelic.com/docs/apm/transactions/cross-application-traces/cross-application-tracing) adds request and response headers to external calls using the Apache HttpClient libraries. This provides better performance data when calling applications monitored by other New Relic agents.
**enabled (DEPRECATED)**
| Type | Boolean |
| ------- | ------- |
| Default | `true` |
[Cross application tracing](https://docs.newrelic.com/docs/apm/transactions/cross-application-traces/cross-application-tracing) is enabled by default. Set this to false to turn it off.
## Custom events [#Custom_Events]
Set custom events settings in the `custom_insights_events` section. You can [override](#System_Properties) these settings with a `newrelic.config.custom_insights_events` prefixed system property.
APM lets you [record custom event data](https://docs.newrelic.com/docs/insights/insights-data-sources/custom-data/insert-custom-events-new-relic-apm-agents) via the New Relic language agent APIs, which [you can then query](https://docs.newrelic.com/docs/query-your-data/explore-query-data/explore-data/introduction-querying-new-relic-data).
> #### ⚠️ IMPORTANT
>
> For Java agent versions prior to 4.1.0, the following YAML configuration is recognized:
>
> ```yml
> custom_insights_events.enabled: true
> custom_insights_events.max_samples_stored: 5000
> ```
>
> For agent versions 4.1.0 and above, the YAML configuration uses the nested section formatting:
>
> ```yml
> custom_insights_events:
> enabled: false
> max_samples_stored: 5000
> ```
**enabled**
| Type | Boolean |
| ------- | ------- |
| Default | `true` |
This enables the custom event service.
**max_attribute_value**
| Type | Integer |
| ------- | ------- |
| Default | `255` |
The maximum size of an attribute value, after which the value will be truncated. The default is `255` bytes (in UTF-8 charset encoding) and the max limit is `4095`.
This config exists in Java agent version 8.9.0+.
**max_samples_stored**
| Type | Integer |
| ------- | ------- |
| Default | `30000` |
- The maximum number of sampled custom events reported every 60 seconds.
- When configuring the agent for [AI monitoring](https://docs.newrelic.com/docs/ai-monitoring/intro-to-ai-monitoring), set to max value `100000`. Ensures that the maximum amount of LLM events are captured.
## Class transformer [#Class_Transformer]
Set instrumentation related settings in the `class_transformer` section. You can override these settings with a `newrelic.config.class_transformer` prefixed [system property](#System_Properties) or a `NEW_RELIC_CLASS_TRANSFORMER_` prefixed [environment variable](#Environment_Variables).
**enhanced_spring_transaction_naming**
| Type | Boolean |
| ------- | ------- |
| Default | False |
When enabled, enhanced Spring transaction naming will name any transaction that originates from a Spring controller after the defined route and HTTP method. For example: `/customer/v1/edit (POST)`. This includes controllers that implement or extend interfaces/classes with WebMVC related annotations (`@RestController`, `@Controller`, `@RequestMapping`, etc).
By default, this is configured to `false`, which will name transactions for those types of controllers based on the controller class name and method. For example; `CustomerController/edit`. This is the naming logic carried over from previous agent versions. "Standard" controllers, with all relevant annotations present on the actual class, will still get named based on route and HTTP method.
This config exists in Java agent version 8.9.0+.
**use_controller_class_and_method_for_spring_transaction_naming**
| Type | Boolean |
| ------- | ------- |
| Default | False |
When enabled, all Spring Controller transactions will be named using the controller class name and method name (e.g., `/CustomerController/edit`) instead of using request mappings (e.g., `/api/v1/customer (POST)`).
This setting takes precedence over `enhanced_spring_transaction_naming` and helps prevent transaction name cardinality issues with complex URI patterns.
Applies to Spring 4.3.x+ (spring-4.3.0 module) and Spring 6.x+ (spring-6.0.0 module).
This config exists in Java agent version 8.25.0+.
**name_actuator_endpoints**
| Type | Boolean |
| ------- | ------- |
| Default | False |
By default, built-in actuator endpoints and custom actuator endpoints (using the `@endpoint` annotation and its subclasses) will all be named as `OperationHandler/handle` in New Relic. Enabling this
setting will result in the transaction name reflecting the actual base actuator endpoint URI. For example, invoking `/actuator/loggers` or `actuator/loggers/com.newrelic` will result in the
transaction name `actuator/loggers (GET)`. This is to prevent MGI.
Supported when using Spring Boot v3 and later.
This config exists in Java agent version 8.15.0+.
**trace_annotation_class_name**
| Type | String |
| ------- | ------ |
| Default | (none) |
String containing the full class name of the annotation class the agent uses to determine which user-specified methods to instrument. For more information about custom annotations, see [Java custom metric collection](https://docs.newrelic.com/docs/java/java-custom-metric-collection).
**com.newrelic.instrumentation.servlet-user**
| Type | Boolean |
| ------- | ------- |
| Default | `false` |
Enable this option to capture the `userPrincipal` name. This name is included as a transaction trace attribute (with attribute names `user` and `enduser.id`), and [can be queried](https://docs.newrelic.com/docs/query-your-data/explore-query-data/explore-data/introduction-querying-new-relic-data). This also allows you to see in [errors inbox how many users are impacted by an error group](https://docs.newrelic.com/docs/errors-inbox/error-users-impacted/).
## Distributed tracing [#dt-main]
> #### ⚠️ IMPORTANT
>
> Enabling distributed tracing disables [cross application tracing](#Cross_Application_Tracer), and has other effects on APM features. Before enabling, read the [transition guide](https://docs.newrelic.com/docs/transition-guide-distributed-tracing).
>
> Requires [Java agent version 4.3.0 or higher](https://docs.newrelic.com/docs/agents/java-agent/installation/upgrade-java-agent).
[Distributed tracing](https://docs.newrelic.com/docs/understand-dependencies/distributed-tracing/get-started/introduction-distributed-tracing) lets you see the path that a request takes as it travels through a distributed system. It is on by default for Java agent version 7.4.0 or higher.
In the config file, you can override this manually in the `distributed_tracing` section. You can also override this using a prefixed system property (`newrelic.config.distributed_tracing`) or an environment variable (`NEW_RELIC_DISTRIBUTED_TRACING_ENABLED`). See the examples below.
For more information about setting up distributed tracing, see [Enable distributed tracing for your Java applications](https://docs.newrelic.com/docs/apm/agents/go-agent/instrumentation/distributed-tracing-go-agent).
**enabled**
| Type | Boolean |
| ------- | ------- |
| Default | `true` |
Set this to `false` to disable distributed tracing. For example, in the config file, you would use:
````yml
distributed_tracing:
enabled: false
```
Here are other options to disable distributed tracing:
[System property](/docs/agents/java-agent/configuration/java-agent-configuration-config-file#System_Properties):
```ini
-Dnewrelic.config.distributed_tracing.enabled=false
```
Evironment variable:
```ini
NEW_RELIC_DISTRIBUTED_TRACING_ENABLED=false
```
````
**exclude_newrelic_header**
| Type | Boolean |
| ------- | ------- |
| Default | `false` |
By default, supported versions of the agent utilize both the `newrelic` header and W3C Trace Context headers for distributed tracing. The `newrelic` distributed tracing header allows interoperability with older agents that don't support W3C Trace Context headers. Agent versions that support W3C Trace Context headers will prioritize them over `newrelic` headers for distributed tracing.
If you do not want to utilize the `newrelic` header, setting this to `true` will result in the agent excluding the `newrelic` header and only using W3C Trace Context headers for distributed tracing.
For example, to exclude `newrelic` headers in the config file, you would use:
````yml
distributed_tracing:
exclude_newrelic_header: true
```
To exclude `newrelic` headers using a [system property](/docs/agents/java-agent/configuration/java-agent-configuration-config-file#System_Properties), you would use:
```ini
-Dnewrelic.config.distributed_tracing.exclude_newrelic_header=true
```
````
**sampler.remote_parent_sampled**
| Type | String |
| ------- | --------- |
| Default | `default` |
This option defines how the agent should handle sampling spans when their parent span from an upstream entity was sampled. For example, setting `remote_parent_sampled: always_on` means the agent will always sample anything sampled by an upstream entity, until the sampling reservoir is full. The possible values are:
- `default`: Use New Relic's standard sampling rules.
- `always_on`: Always sample spans whose upstream parent was sampled.
- `always_off`: Always skip sampling spans whose upstream parent was sampled.
```yaml
distributed_tracing:
sampler:
remote_parent_sampled: default
```
**sampler.remote_parent_not_sampled**
| Type | String |
| ------- | --------- |
| Default | `default` |
This option defines how the agent should handle sampling spans when their parent span from an upstream entity was not sampled. For example, setting `remote_parent_not_sampled: always_off` means the agent will not try to sample anything if the upstream entity did not sample the parent. The possible values are:
- `default`: Use New Relic's standard sampling rules.
- `always_on`: Always sample spans whose upstream parent was not sampled.
- `always_off`: Always skip sampling spans whose upstream parent was not sampled.
```yaml
distributed_tracing:
sampler:
remote_parent_not_sampled: default
```
## Error collector [#Error_Collector]
Set the error collector settings in the `error_collector` section. Unless otherwise noted, you can [override](#System_Properties) these settings with a `newrelic.config.error_collector` prefixed system property. The error collector captures information about uncaught exceptions and sends them to New Relic for viewing.
> #### 💡 TIP
>
> For how to configure errors for the Java agent, including how to configure errors via the UI, see [Java agent error configuration](https://docs.newrelic.com/docs/agents/java-agent/configuration/java-agent-error-configuration).
**enabled**
| Type | Boolean |
| ------- | ------- |
| Default | `true` |
Enable error collection.
**ignore_classes**
| Type | Section containing a list of fully qualified `class_name` strings |
| ------- | ----------------------------------------------------------------- |
| Default | (none) |
Specified exception class names will be ignored and will not affect error rate or Apdex score, or be reported to APM. **Cannot be specified by system property.**
This setting is dynamic, so running agents will notice changes to `newrelic.yml` without a JVM restart.
For example:
````yml
error_collector:
ignore_classes:
- "com.example.MyException"
- "com.example.DifferentException"
```
An environment variable can be used to list exception class names you want to be ignored:
```ini
NEW_RELIC_ERROR_COLLECTOR_IGNORE_CLASSES="[\"com.example.MyException\", \"com.example.DifferentException\"]"
```
````
**ignore_messages**
| Type | Section containing a fully qualified `class_name` and a list of `messages` per error class |
| ------- | ------------------------------------------------------------------------------------------ |
| Default | (none) |
Specify exception class names the agent should ignore. Ignored messages will not affect error rate or Apdex score, or be reported to APM. Contains `yaml` pairs consisting of:
- A fully qualified exception class name that should not be reported to APM
AND
- A list of exception `message`s to match against (at least one is required)
If the exception class name matches an error but the message does not, then that error **will not** be ignored. Message strings use `contains` for matching. A message cannot be provided on its own and must always be paired with a fully qualified class name. **Cannot be specified by system property.**
This setting is dynamic, so running agents will notice changes to `newrelic.yml` without a JVM restart.
For example:
```yml
error_collector:
ignore_messages:
com.example.MyException:
- "Some error message to ignore"
- "Some other error message to ignore"
com.example.DifferentException:
- "Some different error message to ignore"
```
An environment variable can be used to list exception class names and messages you want to be ignored:
```ini
NEW_RELIC_ERROR_COLLECTOR_IGNORE_MESSAGES="{\"com.example.MyException\": [\"Some error message to ignore\", \"Some other error message to ignore\"], \"com.example.DifferentException\": [\"Some different error message to ignore\"]}"
```
**ignore_status_codes**
| Type | Comma-separated list of strings and ranges |
| ------- | ------------------------------------------ |
| Default | `404` |
A comma-separated list comprised of individual and dashed ranges of HTTP status codes that should not be treated as errors.
If this property is commented out in the `newrelic.yml` configuration file, then the 404 status code will automatically be ignored. When using [server-side configuration](https://docs.newrelic.com/docs/agents/manage-apm-agents/configuration/server-side-agent-configuration), the status code 404 must be specified in order for it to be ignored.
This setting is dynamic, so running agents will notice changes to `newrelic.yml` without a JVM restart.
For example:
````yml
error_collector:
ignore_status_codes: 404,507-511
```
````
**expected_classes**
| Type | Section containing a List of fully qualified `class_name` strings |
| ------- | ----------------------------------------------------------------- |
| Default | (none) |
Prevents specified exception classes from affecting error rate or Apdex score while still reporting the errors to APM. **Cannot be specified by system property.**
This setting is dynamic, so running agents will notice changes to `newrelic.yml` without a JVM restart.
For example:
````yml
error_collector:
expected_classes:
- "com.example.MyException"
- "com.example.DifferentException"
```
An environment variable can be used to list expected exception class names:
```ini
NEW_RELIC_ERROR_COLLECTOR_EXPECTED_CLASSES="[\"com.example.MyException\", \"com.example.DifferentException\"]"
```
````
**expected_messages**
| Type | Section containing a fully qualified `class_name` and a List of `messages` per error class |
| ------- | ------------------------------------------------------------------------------------------ |
| Default | (none) |
Contains yaml pairs consisting of a fully qualified exception class name that should be marked as expected and thus prevented from affecting error rate or Apdex score and a List of exception `message`s to match against, the latter of which at least one is required. If the exception class name matches an error but the message does not, then that error **will not** be marked as expected and therefore will affect error rate and Apdex score.
Message strings use `contains` for matching. A message cannot be provided on its own and must always be paired with a fully qualified class name. **Cannot be specified by system property.**
This setting is dynamic, so running agents will notice changes to `newrelic.yml` without a JVM restart.
For example:
````yml
error_collector:
expected_messages:
com.example.MyException:
- "Some expected error message"
- "Some other expected error message"
com.example.DifferentException:
- "Some different expected error message"
```
An environment variable can be used to list expected exception class names and messages:
```ini
NEW_RELIC_ERROR_COLLECTOR_EXPECTED_MESSAGES="{\"com.example.MyException\": [\"Some error message to ignore\", \"Some other error message to ignore\"], \"com.example.DifferentException\": [\"Some different error message to ignore\"]}"
```
````
**expected_status_codes**
| Type | Comma-separated list of strings and ranges |
| ------- | ------------------------------------------ |
| Default | (none) |
A comma-separated list comprised of individual and dashed ranges of HTTP status codes to be marked as expected and thus prevented from affecting error rate or Apdex score.
This setting is dynamic, so running agents will notice changes to `newrelic.yml` without a JVM restart.
For example:
````yml
error_collector:
expected_status_codes: 415,500-506
```
Expected status codes can also be with the `NEW_RELIC_ERROR_COLLECTOR_EXPECTED_STATUS_CODES` environment variable.
````
**attributes.enabled**
| Type | Boolean |
| ------- | ------- |
| Default | `true` |
This setting can be used to turn on or off all attributes for traced errors. If `attributes.enabled` is `false` at the root level, then no attributes will be sent to traced errors regardless of how this property is set under `error_collector`.
**attributes.include**
| Type | List of strings |
| ------- | --------------- |
| Default | (none) |
If attributes are enabled for traced errors, all attribute keys found in this list will be sent to New Relic in traced errors. For more information, see the [agent attribute rules](https://docs.newrelic.com/docs/apm/other-features/attributes/agent-attributes).
**attributes.exclude**
| Type | List of strings |
| ------- | --------------- |
| Default | (none) |
Attribute keys found in this list will not be sent to New Relic in traced errors. For more information, see the [agent attribute rules](https://docs.newrelic.com/docs/apm/other-features/attributes/agent-attributes).
**ignoreErrorPriority**
| Type | Boolean |
| ------- | ------- |
| Default | `true` |
When multiple errors are noticed in a transaction, only the last error will be reported by default. Setting this property to `false` will instead report only the first error that is noticed. For more information, see the [noticeError API](https://docs.newrelic.com/docs/agents/java-agent/configuration/java-agent-error-configuration/).
For example:
````yml
error_collector:
ignoreErrorPriority: false
```
````
**ignore_errors (DEPRECATED)**
| Type | Comma-separated list of Strings |
| ------- | ------------------------------- |
| Default | (none) |
All specified exception class names specified will not be treated as errors. Deprecated as of Java agent 3.40.0 and replaced by [`ignore_classes`](#ec-ignore_classes).
For example:
````yml
error_collector:
ignore_errors: some.other.MyException
```
````
## External tracer [#External_Tracer]
Set the external tracing options in the `external_tracer` section. These options can be [overridden](#System_Properties) with a `newrelic.config.external_tracer` prefixed system property.
**exclude_request_uri**
| Type | Boolean |
| ------- | ------- |
| Default | `false` |
This setting can be used to control the collection of outgoing request URIs for errors and transaction traces. Set this to true to disable collecting this information.
## Hostname configuration [#hostname_configuration]
Set the hostname configuration options in the `process_host` section. These options can be [overridden](#System_Properties) with a `newrelic.config.process_host` prefixed system property.
Use these properties to configure the hostname displayed in the UI:
**display_name**
| Type | String |
| ------- | ------ |
| Default | (none) |
Set a [display name](https://docs.newrelic.com/docs/agents/java-agent/configuration/hostname-logic-java#display-name) to decorate the "host:port" label in the New Relic UI.
**ipv_preference**
| Type | String |
| ------- | ------ |
| Default | `4` |
If the hostname cannot be determined, then the IP address of the host will be used. This property determines whether the IPv4 or IPv6 address should be used. The default is IPv4.
## Infinite Tracing
> #### ⚠️ IMPORTANT
>
> Requirements:
>
> - [Java agent 5.12.1 or higher](https://docs.newrelic.com/docs/agents/java-agent/installation/update-java-agent).
> - Infinite Tracing does not work if `enable_auto_app_naming` is enabled.
To turn on Infinite Tracing, enable distributed tracing and add the additional setting below. For an example, see [Language agents: Configure distributed tracing](https://docs.newrelic.com/docs/understand-dependencies/distributed-tracing/enable-configure/language-agents-enable-distributed-tracing#java-config).
**trace_observer.host**
| Type | String |
| ------- | ------ |
| Default | (none) |
For help getting a valid Infinite Tracing trace observer host entry, see [find or create a Trace Observer](https://docs.newrelic.com/docs/understand-dependencies/distributed-tracing/enable-configure/language-agents-enable-distributed-tracing#provision-trace-observer).
You can configure this via YAML:
````yml
infinite_tracing:
trace_observer:
host: YOUR_TRACE_OBSERVER_HOST
```
You can also use the system property `newrelic.config.infinite_tracing.trace_observer.host` or the environment variable `NEW_RELIC_INFINITE_TRACING_TRACE_OBSERVER_HOST`.
````
## Instrumentation
These options are set in the `instrumentation` stanza and can be overridden by using a `newrelic.config.instrumentation` prefixed system property.
**trace_lambda.enabled**
| Type | Boolean |
| ------- | ------- |
| Default | false |
By default, [@TraceLambda](https://docs.newrelic.com/docs/apm/agents/java-agent/api-guides/java-agent-api-instrument-using-annotation/#tracelambda) annotations are disabled. To use the annotation functionality for tracing lambda methods you must explicitly enable the feature as follows:
You can configure this via YAML:
````yml
instrumentation:
trace_lambda:
enabled: true
```
You can also use the system property `newrelic.config.instrumentation.trace_lambda.enabled=true` or the environment variable `NEW_RELIC_INSTRUMENTATION_TRACE_LAMBDA_ENABLED`.
````
## Jar collector
The Java agent collects information about jars and their versions on the application classpath.
Set the jar collection configuration in the `jar_collector` section. These configuration options can be [overridden](#System_Properties) with a `newrelic.config.jar_collector` prefixed system property. Options include:
**enabled**
| Type | Boolean |
| ------- | ------- |
| Default | `true` |
Used to enable/disable jar collection and reporting.
**skip_temp_jars**
| Type | Boolean |
| ------- | ------- |
| Default | `true` |
Used to enable/disable collection of temporary jars. Temporary jars are those residing in the directory specified by the system property `java.io.tmpdir`.
**jars_per_second**
| Type | Integer |
| ------- | ------- |
| Default | `10` |
The maximum number of jars to process per second. Must be positive.
## JFR (Real-time profiling)
The Java agent uses Java Flight Recorder (JFR) to collect high fidelity JVM data for [Real-time profiling](https://docs.newrelic.com/docs/agents/java-agent/features/real-time-profiling-java-using-jfr-metrics/).
Configure real-time profiling in the `jfr` section in the agent YAML. These configuration options can be overridden with [system properties](#System_Properties) prefixed by `newrelic.config.jfr.` or with [environment variables](#Environment_Variables) prefixed with `NEW_RELIC_JFR_`.
**enabled**
| Type | Boolean |
| ------- | ------- |
| Default | `false` |
Set to `true` to enable [Real-time profiling with JFR](https://docs.newrelic.com/docs/agents/java-agent/features/real-time-profiling-java-using-jfr-metrics/). This setting will apply dynamically and does not require a JVM restart.
> #### ⚠️ IMPORTANT
>
> Real-time profiling with JFR is on by default in Java agent [version 7.1.0](https://docs.newrelic.com/docs/release-notes/agent-release-notes/java-release-notes). If you are on any other agent version 7.0.0 or higher, you can turn on JFR by changing the value to `true`.
**audit_logging**
| Type | Boolean |
| ------- | ------- |
| Default | `false` |
Set to `true` to enable audit logging which will display all JFR metrics and events in each harvest batch. Audit logging is extremely verbose and should only be used for troubleshooting purposes.
> #### ⚠️ IMPORTANT
>
> This applies to Java agent [version `7.0.0` or higher](https://docs.newrelic.com/docs/release-notes/agent-release-notes/java-release-notes).
**harvest_interval**
| Type | Integer |
| ------- | ------- |
| Default | `false` |
The time interval, in seconds, of how often JFR data is sent to New Relic. The default is 10 seconds.
> #### ⚠️ IMPORTANT
>
> This applies to Java agent [version 8.17.0 or higher](https://docs.newrelic.com/docs/release-notes/agent-release-notes/java-release-notes).
**queue_size**
| Type | Integer |
| ------- | ------- |
| Default | `false` |
The maximum number of JFR events stored in the agent's memory queue. Increasing this value can help prevent gaps in JFR data, but it will also increase the agent's resource consumption. If the queue is too large, data may be dropped if backend pipline limits are exceeded.
Default value is set to 250000. For more information, refer to [event API ingest limits](https://docs.newrelic.com/docs/data-apis/ingest-apis/event-api/introduction-event-api/#limits).
> #### ⚠️ IMPORTANT
>
> This applies to Java agent [version 8.17.0 or higher](https://docs.newrelic.com/docs/release-notes/agent-release-notes/java-release-notes).
**use_display_name**
| Type | Boolean |
| ------- | ------- |
| Default | `false` |
The maximum number of JFR events stored in the agent's memory queue. Increasing this value can help prevent gaps in JFR data, but it will also increase the agent's resource consumption. If the queue is too large, data may be dropped if backend pipline limits are exceeded.
Default value is set to 250000. For more information, refer to [event API ingest limits](https://docs.newrelic.com/docs/data-apis/ingest-apis/event-api/introduction-event-api/#limits).
> #### ⚠️ IMPORTANT
>
> This applies to Java agent [version 8.17.0 or higher](https://docs.newrelic.com/docs/release-notes/agent-release-notes/java-release-notes).
## JMX
To set these options, use the `jmx` section. To [override](#System_Properties) them, use a `newrelic.config.jmx` prefixed system property.
The Java agent uses JMX to collect JVM data. Additionally the agent can expose linking metadata over JMX that can be used by other tracing systems.
**enabled**
| Type | Boolean |
| ------- | ------- |
| Default | `true` |
This setting can be used to turn on or off all JMX functionality.
**linkingMetadataMBean**
| Type | Boolean |
| ------- | ------- |
| Default | `false` |
This setting can be enabled to allow the Java agent to expose linking metadata over remote JMX.
> #### ⚠️ IMPORTANT
>
> This applies to Java agent [version 6.1.0 or higher](https://docs.newrelic.com/docs/release-notes/agent-release-notes/java-release-notes).
## JVM properties obfuscation
The Java agent sends JVM properties to New Relic for display in the UI. Starting with Java agent version `8.16.0` the values of most properties will be obfuscated. For example: `-Dprop=12345` will now be sent as `-Dprop=obfuscated`.
Set obfuscation related options, in the `obfuscate_jvm_props` section of the agent YAML. You can override these settings with a `newrelic.config.obfuscate_jvm_props` prefixed [system property](https://docs.newrelic.com/docs/apm/agents/java-agent/configuration/java-agent-configuration-config-file/#System_Properties) or a `NEW_RELIC_OBFUSCATE_JVM_PROPS_` prefixed [environment variable](https://docs.newrelic.com/docs/apm/agents/java-agent/configuration/java-agent-configuration-config-file/#Environment_Variables).
By default, values of properties starting with `-X` won't be obfuscated.
**enabled**
| Type | Boolean |
| ------- | ------- |
| Default | `true` |
Used to enabled/disable obfuscation of JVM properties.
**allow**
| Type | List of strings |
| ------- | --------------- |
| Default | (none) |
If obfuscation is enabled, when the property key matches a value in this list, then the value won't be obfuscated.
The items in this list can have wildcards, `*` as the last character. Conflicts with the block list are resolved following [attribute rules](https://docs.newrelic.com/docs/apm/agents/java-agent/attributes/java-agent-attributes/#attruls), where `allow` works as `include`.
**block**
| Type | List of strings |
| ------- | --------------- |
| Default | (none) |
If obfuscation is enabled, when the property key matches a value in this list, then the value will be obfuscated.
The items in this list can have wildcards, `*` as the last character. Conflicts with the allow list are resolved following [attribute rules](https://docs.newrelic.com/docs/apm/agents/java-agent/attributes/java-agent-attributes/#attruls), where `block` works as `exclude`.
## Kafka message queues [#kafka-message-queues]
Detailed information on Kafka instrumentation configuration and can be found on the [Instrument Kafka message queues](https://docs.newrelic.com/docs/apm/agents/java-agent/instrumentation/java-agent-instrument-kafka-message-queues/) page.
- [Kafka event collection](https://docs.newrelic.com/docs/apm/agents/java-agent/instrumentation/java-agent-instrument-kafka-message-queues/#collect-kafka-events)
- [Kafka node metrics](https://docs.newrelic.com/docs/apm/agents/java-agent/instrumentation/java-agent-instrument-kafka-message-queues/#kafka-node-metrics)
- [Kafka config events](https://docs.newrelic.com/docs/apm/agents/java-agent/instrumentation/java-agent-instrument-kafka-message-queues/#kafka-config)
- [Kafka streams transactions](https://docs.newrelic.com/docs/apm/agents/java-agent/instrumentation/java-agent-instrument-kafka-message-queues/#collect-kafka-streams-transactions)
- [Kafka connect transactions](https://docs.newrelic.com/docs/apm/agents/java-agent/instrumentation/java-agent-instrument-kafka-message-queues/#collect-kafka-connect-transactions)
- [Kafka distributed traces](https://docs.newrelic.com/docs/apm/agents/java-agent/instrumentation/java-agent-instrument-kafka-message-queues/#collect-kafka-distributed-traces)
## Logs in context [#logs-in-context]
Starting with Java agent version `7.6.0`, support for [logs in context](https://docs.newrelic.com/docs/logs/logs-context/java-configure-logs-context-all) has been added to the agent, making it easy to use for supported logging frameworks. For tips on using the Java agent for logs in context, see [Java logs in context](https://docs.newrelic.com/docs/logs/logs-context/java-configure-logs-context-all).
Changing these settings in your local agent configuration file happens dynamically and doesn't require a restart of the agent for those changes to take effect. An example configuration:
```yml
application_logging:
enabled: true
forwarding:
enabled: true
max_samples_stored: 10000
labels:
enabled: false
exclude:
context_data:
enabled: false
include:
exclude:
log_level_denylist: debug
metrics:
enabled: true
local_decorating:
enabled: false
```
Set the logs in context configuration in the `application_logging` section. This can be [overridden](https://docs.newrelic.com/docs/apm/agents/java-agent/configuration/java-agent-configuration-config-file#System_Properties) with a `newrelic.config.application_logging` prefixed system property. The only option available is:
**enabled**
| Type | Boolean |
| ------- | ------- |
| Default | `true` |
Set to `true` to enable the core logs in context feature. When enabled, additional logging framework instrumentation is enabled, whether or not logs are decorated or sent to New Relic.
> #### ⚠️ IMPORTANT
>
> Agent releases 7.7.0 and higher has this feature enabled in the agent configuration file by default.
Set to `false` to completely disable this feature, including the collection of log metrics.
### Log forwarding [#log-forwarding]
If you're using a supported logging framework and want to use the agent to send your application logs to New Relic, you can control that through settings under the `forwarding` section. These settings can be overridden by the `newrelic.config.application_logging.forwarding` prefixed system property. Options available are:
**enabled**
| Type | Boolean |
| ------- | ------- |
| Default | `true` |
Enables the sending of application logs to New Relic.
> #### ⚠️ IMPORTANT
>
> Agent releases 7.7.0 and higher have this feature enabled in the agent configuration file by default.
>
> Using the log forwarding feature will increase your data ingest, which may affect your billing. For more information, see our documentation about [tracking your data ingest](https://docs.newrelic.com/docs/apm/new-relic-apm/getting-started/get-started-logs-context#ingest).
>
> If you have an existing log forwarding solution and are updating your agent to use automatic logs in context, be sure to **disable your old log forwarder**. Otherwise, your app will be sending double log lines. Depending on your account, this could result in double billing. For more information, follow the procedures to disable your [specific log forwarder](https://docs.newrelic.com/docs/logs/forward-logs/enable-log-management-new-relic#log-forwarding).
Set this to `true` to have your decorated logs sent to New Relic.
Set this to `false` if you do not want your decorated logs sent to New Relic.
**max_samples_stored**
| Type | Integer |
| ------- | ------- |
| Default | `10000` |
A positive integer specifying the maximum number of logs lines per minute to send.
Set this to `0` to effectively disable the sending of logs.
> #### ⚠️ IMPORTANT
>
> This controls the number of logs sent _per minute_. Setting `max_samples_stored` to `0` - or any value less than `12` - does _not_ disable the feature itself, though it does result in no log lines being sent to New Relic.
Set this to a lower value to reduce the amount of log lines sent (may cause log sampling). Set this to a higher value to send more log lines.
Each log receives the same priority as its associated transaction. Logs that occur outside of a transaction will receive a random priority. Some logs may not be included because they are limited by `max_samples_stored`. For example, if logging `max_samples_stored` is set to 10,000 and transaction 1 has 10,000 log entries, only log entries for transaction 1 will be recorded. If transaction 1 has less than 10,000 logs you receive all logs for transaction 1. If there is still space, you receive all the logs for transaction 2, and so on.
If after all the logs for sampled transactions are recorded, and they haven't reached the limit in `max_samples_stored`, then log messages for transactions that were not in our sampling are sent. If there are any left, log messages outside of transactions are recorded.
#### Log labels (tags) [#log-labels]
The Java agent supports adding custom labels (tags) to agent-forwarded logs. Labels are sourced from the [labels](#labels) section at the top level of the agent configuration. This feature can be enabled within the `labels` section, nested under the `forwarding` section. You can override these settings using the `newrelic.config.application_logging.forwarding.labels` prefixed system property. Available options include:
**enabled**
| Type | Boolean |
| ------- | ------- |
| Default | `false` |
Toggles whether the agent will add labels to logs that are forwarded to New Relic.
**exclude**
| Type | List of strings |
| ------- | --------------- |
| Default | (none) |
A case-insensitive list of label names to **exclude** when labels for logs are enabled. This attribute does not support wildcards or regex.
When adding labels as attributes, the agent prefixes the keys with tags.. This prefix is NOT included when matching against the exclude filtering rules.
#### Log context data [#log-context-data]
The Java agent can capture context data (Mapped Diagnostic Context in logback/slf4j, ThreadContext in log4j2) and add its contents as attributes in the logs forwarded to New Relic. You can control that through settings in the `context_data` section, nested under the `forwarding` section. These settings can be overridden by the `newrelic.config.application_logging.forwarding.context_data` prefixed system property. Options available are:
**enabled**
| Type | Boolean |
| ------- | ------- |
| Default | `false` |
Set this to `true` sending of context data as log attributes to New Relic.
Set this to `false` if you do not want context data in the logs sent to New Relic.
**include**
| Type | List of strings |
| ------- | --------------- |
| Default | (none) |
If `context_data` is enabled for log forwarding, all attribute keys found in this list will be sent to New Relic in log records. If this list is empty, then all attributes will be sent.
**exclude**
| Type | List of strings |
| ------- | --------------- |
| Default | (none) |
If `context_data` is enabled for log forwarding, all attribute keys found in this list will NOT be sent to New Relic in log records.
The include and exclude list follow the rules `Exclude overrides include`, `More specific rules take priority`, `Keys are case-sensitive` and `Use an asterisk for wildcards` defined in [Attribute rules](https://docs.newrelic.com/docs/apm/agents/java-agent/configuration/java-agent-configuration-config-file).
#### Log Level Denylist [#log-level-denylist]
The Java agent can omit specific log levels from generating LogEvents that get forwarded to New Relic.
You can control that through the `log_level_denylist` config option, nested under the `forwarding` section. This setting allows you to define a comma separated list of strings representing log levels (e.g. `log_level_denylist: "info, debug"`) that should not have log events forwarded. Log level names are case-insensitive but otherwise must be an exact match. These settings can be overridden by the `newrelic.config.application_logging.forwarding.log_level_denylist` prefixed system property. The only available option is:
**log_level_denylist**
| Type | List of strings |
| ------- | --------------- |
| Default | (none) |
### Log metrics [#log-metrics]
In addition to allowing you to decorate and send individual log lines, the Java agent can capture logging metric data. You can find this data in the logs chart in the New Relic UI. You can configure log metrics settings in the `metrics` section. You can override these settings with the `newrelic.config.application_logging.metrics` prefixed system property. The only available option is:
**enabled**
| Type | Boolean |
| ------- | ------- |
| Default | `true` |
Enables the capture of metrics information about your logs and log levels, which is displayed in a chart on the APM **Summary** page.
Leave this set to `true` to allow the agent to capture metric information about your logs.
Set this to `false` to disable this feature.
> #### ⚠️ IMPORTANT
>
> If you disable the collection of log metrics, the log chart on the summary page will appear blank.
### Log decorating [#log-decorating]
You can configure the log decorating settings in the `local_decorating` section. You can use this to control how local log lines are decorated. You can override these settings with a `newrelic.config.application_logging.local_decorating` prefixed system property. The only option available is:
**enabled**
| Type | Boolean |
| ------- | ------- |
| Default | `false` |
This controls whether locally stored log lines are decorated or not. This is independent of whether log forwarding is enabled or not and is used to support customers that want to use a separate log forwarding solution.
Set this to `true` to cause the agent to add logs in context linking metadata to log lines stored locally by supported frameworks.
> #### ⚠️ IMPORTANT
>
> Enabling local log decorating will add linking metadata to your application log files, resulting in an increase in disk storage. Disable this feature if this is unacceptable.
>
> It is not necessary to use local log decorating when log forwarding is enabled. Doing so will cause linking metadata to be added to your log messages unnecessarily, which may be visually distracting.
Set this to `false` to turn off the local decorating feature. This will _not_ impact the decorating of log lines being sent to New Relic.
## Logging configuration [#Logging-Configuration]
These are part of the general configuration variables. They are broken out here because they are frequently tweaked for debugging.
Some of the logging configuration variables are dynamic and do not need a host restart for them to take effect. For instance, if log files are growing too quickly, [`log_level`](#cfg-log_level) can be set to a less verbose setting to reduce the reporting rate.
Here is the order of precedence and explanation for configuration variables affecting log rotation.
- If `log_daily` is `true`:
- A `log_limit_in_kbytes` value greater than zero will result in a composite triggering policy, where logs will roll once per day or when the defined size is reached, retaining up to `log_file_count` files
- A `log_limit_in_kbytes` value of zero will result in logs rolling once per day retaining up to `log_file_count` files
- If `log_daily` is `false` and `log_limit_in_kbytes` > 0, a sized based policy will be configured, where logs will roll when the defined size is reached, retaining up to `log_file_count` files
- If `log_daily` is `false` and `log_limit_in_kbytes` = 0, no log file rolling logic will be configured
Depending on the growth rate, it is possible for the log file size to exceed the configured value by a small amount.
**log_daily**
| Type | Boolean |
| ------- | ------- |
| Default | `false` |
Set to `true` to roll the logs daily.
**log_file_count**
| Type | Integer |
| ------- | ------- |
| Default | `1` |
The maximum number of log files to keep when using log rotation.
**log_file_name**
| Type | String |
| ------- | -------------------- |
| Default | `newrelic_agent.log` |
The unqualified log file name or the string `STDOUT` which will log to standard out.
**log_file_path**
| Type | String |
| ------- | --------------------------------------------------- |
| Default | `logs` subdirectory where `newrelic.jar` is located |
The log file path.
> #### 💡 TIP
>
> If `log_file_path` is specified, the directory must already exist. If the default value is used, the agent will attempt to create the directory.
**log_level**
| Type | String |
| ------- | ------ |
| Default | `info` |
The log verbosity level. When you change this setting in the agent yaml config file, it will update dynamically. However, the environment variable and system property will not update dynamically.
The agent uses its own log file to keep its logging separate from that of your application. Valid options, in order of verboseness, are:
- `off`
- `severe`
- `warning`
- `info`
- `fine`
- `finer`
- `finest`
> #### ⚠️ CAUTION
>
> Do not use `debug` or `trace` logging unless New Relic Support asks you to use them. These levels of logging can generate excessive overhead. For most situations, use `info`.
This setting is dynamic, so running agents will notice changes to `newrelic.yml` without a JVM restart.
**log_limit_in_kbytes**
| Type | Integer |
| ------- | ------- |
| Default | `0` |
The log file size in kilobytes at which log files are rotated. Set to `0` for no limit.
## Message tracer [#Transaction_Tracer]
Set message tracer options in the `message_tracer` section. You can [override](#System_Properties) these settings with a `newrelic.config.message_tracer` prefixed system property.
**segment_parameters.enabled**
| Type | Boolean |
| ------- | ------- |
| Default | `true` |
Adds message properties to tracer attributes. Set this to `false` to turn it off.
## OpenTelemetry [#opentelemetry]
Starting with Java agent version `9.1.0`, OpenTelemetry Tracing, Metrics, and Logs API compatibility has been added, offering a "best-of-both-worlds" experience by combining New Relic’s deep visibility with OpenTelemetry signals.
With this functionality, OpenTelemetry Tracing, Metrics, and Logs APIs may be used to directly custom instrument your application, in combination with New Relic Java agent APIs, while the Java agent seemlessly combines it all together into a familiar APM experience. Additionally, some libraries that provide OpenTelemetry native or standalone library instrumentation may be used to provide enhanced visibility into your application.
The following configuration options determine which OpenTelemetry signals should be captured and incorporated into the New Relic APM experience.
```yml
opentelemetry:
enabled: false
logs:
enabled: true
metrics:
enabled: true
include: "MeterName1,MeterName2"
exclude: "MeterName3,MeterName4"
traces:
enabled: true
include: "TracerName1,TracerName2"
exclude: "TracerName3,TracerName4"
```
**enabled**
| Type | Boolean |
| ------- | ------- |
| Default | `false` |
Set to true to allow individual OpenTelemetry signals to be enabled, false to disable all OpenTelemetry signals.
Default is false.
Can be set via the system property:
````ini
-Dnewrelic.config.opentelemetry.enabled=false
```
Can be set via the environment variable:
```ini
NEW_RELIC_OPENTELEMETRY_ENABLED
```
````
**logs.enabled**
| Type | Boolean |
| ------- | ------- |
| Default | `true` |
Set to true to enable OpenTelemetry Logs signals when `opentelemetry.enabled=true`.
Default is true.
Can be set via the system property:
````ini
-Dnewrelic.config.opentelemetry.logs.enabled=true
```
Can be set via the environment variable:
```ini
NEW_RELIC_OPENTELEMETRY_LOGS_ENABLED
```
````
**metrics.enabled**
| Type | Boolean |
| ------- | ------- |
| Default | `true` |
Set to true to enable OpenTelemetry Metrics signals when `opentelemetry.enabled=true`.
Default is true.
Can be set via the system property:
````ini
-Dnewrelic.config.opentelemetry.metrics.enabled=true
```
Can be set via the environment variable:
```ini
NEW_RELIC_OPENTELEMETRY_METRICS_ENABLED
```
````
**metrics.include**
| Type | String |
| ------- | ------ |
| Default | (none) |
A comma-delimited string of OpenTelemetry Meters (e.g. "MeterName1,MeterName2") whose signals should be included. By default, all Meters are included. This will override any default Meter excludes in the agent, effectively re-enabling them.
Default is empty string.
Can be set via the system property:
````ini
-Dnewrelic.config.opentelemetry.metrics.include=MeterName1,MeterName2
```
Can be set via the environment variable:
```ini
NEW_RELIC_OPENTELEMETRY_METRICS_INCLUDE
```
````
**metrics.exclude**
| Type | String |
| ------- | ------ |
| Default | (none) |
A comma-delimited string of OpenTelemetry Meters (e.g. "MeterName3,MeterName4") whose signals should be excluded.This takes precedence over all other includes/excludes sources, effectively disabling the listed Meters.
Default is empty string.
Can be set via the system property:
````ini
-Dnewrelic.config.opentelemetry.metrics.exclude=MeterName3,MeterName4
```
Can be set via the environment variable:
```ini
NEW_RELIC_OPENTELEMETRY_METRICS_EXCLUDE
```
````
**traces.enabled**
| Type | Boolean |
| ------- | ------- |
| Default | `true` |
Set to true to enable OpenTelemetry Traces signals when `opentelemetry.enabled=true`.
Default is true.
Can be set via the system property:
````ini
-Dnewrelic.config.opentelemetry.traces.enabled=true
```
Can be set via the environment variable:
```ini
NEW_RELIC_OPENTELEMETRY_TRACES_ENABLED
```
````
**traces.include**
| Type | String |
| ------- | ------ |
| Default | (none) |
A comma-delimited string of OpenTelemetry Tracers (e.g. "TracerName1,TracerName2") whose signals should be included. By default, all Tracers are included. This will override any default Tracer excludes in the agent, effectively re-enabling them.
Default is empty string.
Can be set via the system property:
````ini
-Dnewrelic.config.opentelemetry.traces.include=TracerName1,TracerName2
```
Can be set via the environment variable:
```ini
NEW_RELIC_OPENTELEMETRY_TRACES_INCLUDE
```
````
**traces.exclude**
| Type | String |
| ------- | ------ |
| Default | (none) |
A comma-delimited string of OpenTelemetry Tracers (e.g. "TracerName3,TracerName4") whose signals should be excluded. This takes precedence over all other includes/excludes sources, effectively disabling the listed Tracers.
Default is empty string.
Can be set via the system property:
````ini
-Dnewrelic.config.opentelemetry.traces.exclude=TracerName3,TracerName4
```
Can be set via the environment variable:
```ini
NEW_RELIC_OPENTELEMETRY_TRACES_EXCLUDE
```
````
## Security Agent [#sec-agent]
[New Relic Security agent interactive applications security testing](https://docs.newrelic.com/docs/iast/introduction/) (IAST) tests your applications for any exploitable vulnerability by replaying the generated HTTP request with vulnerable payloads.
> #### ⚠️ IMPORTANT
>
> Run IAST with non-production deployments only to avoid exposing vulnerabilities on your production software.
You can set the New Relic Security agent configuration in the `security` section. These settings can be [overridden](#System_Properties) with a `newrelic.config.security` prefixed system property. Options include:
**agent.enabled**
| Type | Boolean |
| ------- | ------- |
| Default | `false` |
To completely disable all security functionality, set this flag to false. This property is read only once at application start. Default is false.
**enabled**
| Type | Boolean |
| ------- | ------- |
| Default | `false` |
Determines whether the security data is sent to New Relic or not. When this is disabled and agent.enabled is true, the security module will run but data will not be sent. Default is false.
**mode**
| Type | String |
| ------- | ------ |
| Default | `IAST` |
New Relic Security provide mode: IAST. Default is IAST. Due to the invasive nature of IAST scanning, DO NOT enable this mode in either a production environment or an environment where production data is processed.
**validator_service_url**
| Type | String |
| ------- | ------------------------ |
| Default | `wss://csec.nr-data.net` |
New Relic Security’s SaaS connection URL. This is the endpoint that the security agent sends data to, it should match that environment that you have set for the APM Java agent.
US Production: wss://csec.nr-data.net
**detection.rci.enabled**
| Type | Boolean |
| ------- | ------- |
| Default | `true` |
Enable RCI security event detection. Default is true.
**detection.rxss.enabled**
| Type | Boolean |
| ------- | ------- |
| Default | `true` |
Enable RXSS security event detection. Default is true.
**detection.deserialization.enabled**
| Type | Boolean |
| ------- | ------- |
| Default | `true` |
Enable deserialization security event detection. Default is true.
> #### ⚠️ IMPORTANT
>
> New Relic Security agent interactive applications security testing (IAST) mode requires [Java agent version 8.4.0 or higher](https://docs.newrelic.com/docs/agents/java-agent/installation/upgrade-java-agent).
## Skip Applications [#skip-applications]
The agent can be selectively enabled or disabled based on the startup main class or executable jar file that is extracted from the command line. This is handy in situations where the "JAVA_TOOL_OPTIONS" environment
variable is present and contains the -javaagent flag but we don't want to apply the instrumentation to all java apps in the environment - for example in a Kubernetes container.
> #### ⚠️ IMPORTANT
>
> The skip configuration is only supported via a system property an environment variable because of how early in the agent lifecycle the skip configuration needs to be checked.
For diagnostic purposes, if any of the exclude or include configuration variables are defined, the agent will print the extracted command line and parsed skip tokens to stdout:
```
New Relic Agent: New Relic Agent: Configured startup Java artifacts [include|skip] string: keytool,Main
New Relic Agent: Retrieved current startup command line / main artifact name: /Users/bob/.sdkman/candidates/java/11.0.17-amzn/bin/keytool
```
If the agent is disabled based on a include or skip configuration variable, the following will be dumped to stdout:
```
----------
New Relic Agent is disabled by startup class/jar skip or include configuration.
----------
```
**NEW_RELIC_STARTUP_JAVA_ARTIFACT_SKIPS**
| Type | List of strings |
| ------- | --------------- |
| Default | (none) |
A comma separated list of main classes, executable jar files or Java based tools/apps that the agent should NOT instrument. For example:
`NEW_RELIC_STARTUP_JAVA_ARTIFACT_SKIPS=keytool,myapp.jar,IgnoreThisClass`. The corresponding system property is `newrelic.config.startup_java_artifact_skips`.
**NEW_RELIC_STARTUP_JAVA_ARTIFACT_INCLUDES**
| Type | List of strings |
| ------- | --------------- |
| Default | (none) |
A comma separated list of main classes, executable jar files or Java based tools/apps that the agent SHOULD instrument. For example:
`NEW_RELIC_STARTUP_JAVA_ARTIFACT_INCLUDES=myapp.jar`. The corresponding system property is `newrelic.config.startup_java_artifact_includes`.
## Slow transaction Detection
The agent can now detect slow transactions via `SlowTransaction` events since Java Agent version `8.7.0`.
These events are recorded when the transaction length exceed a certain threshold. By default the treshold is 600000 milliseconds (10 minutes).
Slow transaction detection is set in the `slow_transactions` and can be [overridden](#System_Properties) by using a `newrelic.config.slow_transactions` prefixed system property. Options include:
**enabled**
| Type | Boolean |
| ------- | ------- |
| Default | `true` |
Used to enable/disable slow transaction detection.
**threshold**
| Type | Integer |
| ------- | -------- |
| Default | `600000` |
Determines how long a transaction has to take in milliseconds for a `SlowTransaction` event to be reported.
**evaluate_completed_transaction**
| Type | Boolean |
| ------- | ------- |
| Default | `true` |
If this is set to true, every transaction will be checked for exceeding the defined threshold on
transaction completion. Note that if a large number of transactions exceed the threshold,
this can be computationally expensive since a stack trace is sent with every SlowTransaction event.
## Span events
[Span events](https://docs.newrelic.com/docs/apm/distributed-tracing/ui-data/span-event) are reported for [distributed tracing](#distributed-tracing). You must enable distributed tracing to report span events.
Set span events configuration in the `span_events` section. These settings can be [overridden](#System_Properties) with a `newrelic.config.span_events` prefixed system property. Options include:
**enabled**
| Type | Boolean |
| ------- | ------- |
| Default | `true` |
Used to enable/disable span event reporting.
**max_samples_stored**
| Type | Integer |
| ------- | ------- |
| Default | `2000` |
| Max | `10000` |
- Determines the number of span events that can be captured during an agent harvest cycle. Available in Java agent 7.4.0 and above.
- When configuring the agent for [AI monitoring](https://docs.newrelic.com/docs/ai-monitoring/intro-to-ai-monitoring), set to max value `10000`. Ensures that the maximum amount of traces are captured.
> #### ⚠️ IMPORTANT
>
> Increasing the number of span events can lead to additional agent overhead.
**attributes.enabled**
| Type | Boolean |
| ------- | ------- |
| Default | `true` |
This setting can be used to turn on or off all attributes for span events. If `attributes.enabled` at the root level is `false`, no attributes will be sent to span events regardless on how this property (`span_events.attributes.enabled`) is set.
**attributes.include**
| Type | List of strings |
| ------- | --------------- |
| Default | (none) |
If attributes are enabled for span events, all attribute keys found in this list will be sent to New Relic in `span_events`. For more information, see the [agent attribute rules](https://docs.newrelic.com/docs/apm/other-features/attributes/agent-attributes).
**attributes.exclude**
| Type | List of strings |
| ------- | --------------- |
| Default | (none) |
All attribute keys found in this list will not be sent to New Relic in span events. For more information, see the [agent attribute rules](https://docs.newrelic.com/docs/apm/other-features/attributes/agent-attributes).
> #### ⚠️ IMPORTANT
>
> Span event attribute filtering requires [Java agent version 4.10.0 or higher](https://docs.newrelic.com/docs/agents/java-agent/installation/upgrade-java-agent).
## Strip exceptions [#strip_exceptions]
Set the strip exceptions options in the `strip_exception_messages` section. These options can be [overridden](#System_Properties) with a `newrelic.config.strip_exception_messages` prefixed system property. Enable this setting to control whether Java exception messages are reported to New Relic.
**enabled**
| Type | Boolean |
| ------- | ------- |
| Default | `false` |
By default, this is set to `false`, which means that the agent sends messages from all exceptions to the [New Relic collector](https://docs.newrelic.com/docs/accounts-partnerships/education/getting-started-new-relic/glossary#collector).
- If you set this to `true`, the agent strips the messages from exceptions in order to prevent it from inadvertently capturing sensitive information.
- If you enable [high-security mode](https://docs.newrelic.com/docs/agents/manage-apm-agents/configuration/high-security-mode), this is automatically set to `true`.
- If you set `enabled` to `true` but you want the agent to capture messages from specific exceptions, add the exceptions to your [allow list](#strip_exception_messages_whitelist).
**whitelist (DEPRECATED)**
| Type | String |
| ------- | ------ |
| Default | (none) |
> #### ⚠️ IMPORTANT
>
> This config has been deprecated as of agent version 5.10.0 and will be removed in a future agent version. Instead use `allowed_classes`.
If you set `enabled` to `true` but you want the agent to capture messages for specific exceptions, add each exception to the `whitelist`, separated by a comma.
**allowed_classes**
| Type | String |
| ------- | ------ |
| Default | (none) |
If you set `enabled` to `true` but you want the agent to capture messages for specific exceptions, add each exception to `allowed_classes`, separated by a comma.
## Temporary Jar File Removal [#temporary-jar-file-removal]
In some customer environments, agent temporary jars aren't properly cleaned up, even though these jars are marked to be deleted on termination of the JVM. This is likely due to abnormal termination of the JVM.
This configuration directs the agent to delete any temporary agent jar files older than the specified value on startup.
This configuration is only supported via a system property or an environment variable because of how early in the agent lifecycle the file deletion must occur.
For diagnostic purposes, if this feature is enabled, the following will be written to the console:
```
New Relic Agent: Removing stale temporary agent file jars from [temporaryFolder] older than [X] hour(s)
```
If any files are deleted, the following will be written to the console:
```
New Relic Agent: Deleted [count] stale temporary jar files freeing up [totalBytes] bytes
```
**NEW_RELIC_TEMP_JARFILE_AGE_THRESHOLD_HOURS**
| Type | Integer |
| ------- | ------- |
| Default | 0 |
The value is the number of hours old a temp jar needs to be in order to be deleted (whole numbers only).
The default value is 0, which disables the file deletion check. The corresponding system property is `newrelic.config.temp_jarfile_age_threshold_hours`.
## Thread profiler [#Thread_Profiler]
Set the thread profiler options in the `thread_profiler` section. These options can be [overridden](#System_Properties) with a `newrelic.config.thread_profiler` prefixed system property.
Thread profiler measures wall clock time, CPU time, and method call counts in your application's threads as they run.
**enabled**
| Type | Boolean |
| ------- | ------- |
| Default | `true` |
Enable the thread profiler.
## Transaction events [#Transaction_Events]
Set the transaction events options in the `transaction_events` section. These options can be [overridden](#System_Properties) with a `newrelic.config.transaction_events` prefixed system property.
Transaction events data is used to display histograms and percentiles in the UI.
> #### ⚠️ IMPORTANT
>
> Previously, this section was called `analytics_events`. If your configuration file still uses `analytics_events`, update your agent to use `transaction_events`.
**enabled**
| Type | Boolean |
| ------- | ------- |
| Default | `true` |
Enable the transaction events service.
**max_samples_stored**
| Type | Integer |
| ------- | ------- |
| Default | `2000` |
| Max | `10000` |
The maximum number of sampled transaction events reported every 60 seconds.
> #### ⚠️ IMPORTANT
>
> The minimum number of sample transaction events is 12. Agents with version 5.5.0 or higher send data every 5 seconds. If you set the number of events to less than 12, the number of events sent during the harvest cycle will be insufficient, resulting in no data being sent.
**custom_request_headers**
| Type | List of maps |
| ------- | ------------ |
| Default | (none) |
> #### ⚠️ IMPORTANT
>
> Unlike other settings, `custom_request_headers` have to be paired together and must be set in the `newrelic.yml` file. They can't be overwritten by Java virtual machine arguments (system property) or environment variables.
A list of maps with the paired keys `header_name` and the optional `header_alias`. Choose one or more custom HTTP request headers to add as transaction attributes.
You can list multiple header configurations:
````yml
transaction_events:
custom_request_headers:
-
header_name: "X-Custom-Header-1"
-
header_name: "X-Custom-Header-2"
header_alias: "CustomHeader2alias"
```
In the first map set, `X-Custom-Header-1` is captured and reported by the agent as the header name for a corresponding value from the request object. The `header_name` will also be the name of the attribute sent to New Relic.
In the second map set, the request header is `X-Custom-Header-2`, but the `CustomHeader2alias` is the name sent to New Relic.
````
**attributes.enabled**
| Type | Boolean |
| ------- | ------- |
| Default | `true` |
This setting can be used to turn on or off all attributes for transaction events. If `attributes.enabled` is `false` at the root level, then no attributes will be sent to transaction events regardless of how this property is set under `transaction_events`.
**attributes.include**
| Type | List of Strings |
| ------- | --------------- |
| Default | (none) |
If attributes are enabled for transaction events, all attribute keys found in this list will be sent to New Relic in transaction events. For more information, see the [agent attribute rules](https://docs.newrelic.com/docs/apm/other-features/attributes/agent-attributes).
**attributes.exclude**
| Type | List of Strings |
| ------- | --------------- |
| Default | (none) |
All attribute keys found in this list will not be sent to New Relic in transaction events. For more information, see the [agent attribute rules](https://docs.newrelic.com/docs/apm/other-features/attributes/agent-attributes).
## Transaction segments
Set the transaction segments options in the `transaction_segments` section. These options can be [overridden](#System_Properties) with a `newrelic.config.transaction_segments` prefixed system property.
Transaction segments represent discrete pieces of work (generally method calls) and are displayed within [transaction traces](https://docs.newrelic.com/docs/traces/transaction-traces).
> #### ⚠️ IMPORTANT
>
> Transaction segment attribute filtering requires [Java agent version 4.10.0 or higher](https://docs.newrelic.com/docs/agents/java-agent/installation/upgrade-java-agent).
**attributes.enabled**
| Type | Boolean |
| ------- | ------- |
| Default | `true` |
This setting can be used to turn on or off all attributes for transaction segments. If `attributes.enabled` at the root level is `false`, no attributes will be sent to transaction segments regardless on how this property (`transaction_segments.attributes.enabled`) is set.
**attributes.include**
| Type | List of strings |
| ------- | --------------- |
| Default | (none) |
If attributes are enabled for transaction segments, all attribute keys found in this list will be sent to New Relic in transaction segments. For more information, see the [agent attribute rules](https://docs.newrelic.com/docs/apm/other-features/attributes/agent-attributes).
**attributes.exclude**
| Type | List of Strings |
| ------- | --------------- |
| Default | (none) |
All attribute keys found in this list will not be sent to New Relic in transaction segments. For more information, see the [agent attribute rules](https://docs.newrelic.com/docs/apm/other-features/attributes/agent-attributes).
## Transaction tracer
Set the transaction tracer options in the `transaction_tracer` section. These options can be [overridden](#System_Properties) with a `newrelic.config.transaction_tracer` prefixed system property.
[Transaction tracing](https://docs.newrelic.com/docs/traces/transaction-traces) captures deep information about slow transactions and sends this to the New Relic service. The transaction includes the exact call sequence of the transactions, including any query statements issued.
> #### ⚠️ IMPORTANT
>
> Do not use brackets `[suffix]` at the end of your transaction name. New Relic automatically strips brackets from the name. Instead, use parentheses `(suffix)` or other symbols if needed.
**enabled**
| Type | Boolean |
| ------- | ------- |
| Default | `true` |
The transaction tracer is enabled by default. Set this to `false` to turn it off.
**explain_enabled**
| Type | Boolean |
| ------- | ------- |
| Default | `true` |
Determines whether the agent will capture the `EXPLAIN` plan for slow queries. [Only supported for MySQL and PostgreSQL.](https://docs.newrelic.com/docs/agents/java-agent/getting-started/compatibility-requirements-java-agent#JDBC)
**explain_threshold**
| Type | Float |
| ------- | ----- |
| Default | `0.5` |
Threshold in seconds for query execution time below which the slow query and the `EXPLAIN` plan ([if supported](https://docs.newrelic.com/docs/agents/java-agent/getting-started/compatibility-requirements-java-agent#JDBC)) will not be captured. Relevant to slow queries only when `record_sql` is set to `raw` or `obfuscated`. Relevant to `EXPLAIN` plans only when `explain_enabled` is set to `true`.
**exec_call_sql_regex_disabled**
| Type | Boolean |
| ------- | ------- |
| Default | `false` |
For large SQL statements, executing the regular expressions that attempt to parse exec and call statements can take a significant amount of time.
Setting this to true will disable the execution of these complex regular expressions.
This config exists in Java agent version 8.25.0+.
**insert_sql_max_length**
| Type | Integer |
| ------- | ------- |
| Default | `2000` |
The character limit for the SQL query string. If you have many slow SQL queries with large chunks of information, this could negatively affect performance or how quickly you see your data in New Relic. Increase the value gradually until you find the right balance of information and performance.
**log_sql**
| Type | Boolean |
| ------- | ------- |
| Default | `false` |
Set to `true` to enable logging of queries to the agent log file instead of uploading to New Relic. Queries are logged using the `record_sql` mode.
**record_sql**
| Type | String |
| ------- | ------------ |
| Default | `obfuscated` |
When the transaction tracer is on, query statements can optionally be recorded. The recorder has three modes:
- `off`: Send no queries.
- `raw`: Send the query statement in its original form.
- `obfuscated`: Strips out numeric and string literals.
**sql_metadata_comments**
| Type | String |
| ------- | -------- |
| Default | `(none)` |
Controls the addition of comments to the beginning of executed SQL statements to be used by the New Relic Query Performance Monitoring
product for entity linking. Default is false.
A resulting comment would resemble this:
/_nr_service_guid=MTE3NDc2MDB8QVBNfAAAAAxJQEEEEE9OfDI4MTc5NDEIEA_/
**stack_based_naming (Play 2.x+ only)**
| Type | Boolean |
| ------- | -------------------------------------------------------------------------------------------- |
| Default | `false` Defaulted to `true` until Java agent version 3.12.1, when it was changed to `false`. |
This option is for Play 2.x+ only. Play/Scala instrumentation can use `Thread.getStackTrace()` to improve tracer naming, but at the cost of increased overhead.
**stack_trace_threshold**
| Type | Integer |
| ------- | ------- |
| Default | `0.5` |
Defines a threshold (in seconds) for collecting stack traces from an SQL call. When SQL statements exceed this threshold, the agent will capture the current stack trace. This is useful for pinpointing where long SQL calls originate from.
**top_n**
| Type | Integer |
| ------- | ------- |
| Default | `20` |
Use this setting to control the variety of your transaction traces. `top_n` is an integer that represents the number of unique, slow transactions that traces will be created for.
- If you want transaction traces to more accurately reflect the actual slowest transactions in your app, make this value **lower**.
- If you want to sample a more diverse array of transactions, make the value **higher**.
A value of `0` would mean that **only** the slowest transaction is always traced. This is considered not to be optimal, though, because you may have one or two transactions that are always the slowest, and repeatedly seeing those same transaction traces will probably not give you much value.
If the same transaction is often the slowest, the `top_n` setting allows the Java agent (over time) to sample the slowest `n` transactions. This gives you greater variety and more insight into your application.
**transaction_threshold**
| Type | String (float) |
| ------- | -------------- |
| Default | `apdex_f` |
The time threshold used to determine when a transaction is eligible to be traced. When the transaction's response time exceeds this threshold, the transaction becomes eligible for a [transaction trace](https://docs.newrelic.com/docs/apm/transactions/transaction-traces/transaction-traces). If sampled, that transaction trace will be recorded and sent to New Relic.
The default is `apdex_f` (default), which sets the threshold to be the ["Frustrated"](https://docs.newrelic.com/docs/accounts-partnerships/education/getting-started-new-relic/glossary#apdex_f) [Apdex](https://docs.newrelic.com/docs/site/apdex-measuring-user-satisfaction) level (four times the `apdex_t` value). You can also set a specific time threshold by entering a float value that represents a number of seconds.
**slow_query_whitelist (DEPRECATED)**
| Type | String |
| ------- | ------ |
| Default | (none) |
> #### ⚠️ IMPORTANT
>
> This config has been deprecated as of agent version 5.10.0 and will be removed in a future agent version. Instead use `collect_slow_queries_from`.
By default, [high-security mode](https://docs.newrelic.com/docs/accounts-partnerships/accounts/security/high-security) does not allow the agent to collect [slow queries](https://docs.newrelic.com/docs/apm/applications-menu/monitoring/viewing-slow-query-details). Enable this option to collect Cassandra queries from the DataStax driver, even with high security enabled. If you don't use high security, the agent collects slow queries automatically.
For DataStax driver 2.1.2, add this rule to your allow list:
````yml
transaction_tracer:
slow_query_whitelist:
'com.newrelic.instrumentation.cassandra-datastax-2.1.2'
```
For DataStax driver 3.0.0, add this rule to your allow list:
```yml
transaction_tracer:
slow_query_whitelist:
'com.newrelic.instrumentation.cassandra-datastax-3.0.0'
```
````
**collect_slow_queries_from**
| Type | String |
| ------- | ------ |
| Default | (none) |
By default, [high-security mode](https://docs.newrelic.com/docs/accounts-partnerships/accounts/security/high-security) does not allow the agent to collect [slow queries](https://docs.newrelic.com/docs/apm/applications-menu/monitoring/viewing-slow-query-details). Enable this option to collect Cassandra queries from the DataStax driver, even with high security enabled. If you don't use high security, the agent collects slow queries automatically.
For DataStax driver 2.1.2, add this rule to your allow list:
````yml
transaction_tracer:
collect_slow_queries_from:
'com.newrelic.instrumentation.cassandra-datastax-2.1.2'
```
For DataStax driver 3.0.0, add this rule to your allow list:
```yml
transaction_tracer:
collect_slow_queries_from:
'com.newrelic.instrumentation.cassandra-datastax-3.0.0'
```
````
**attributes.enabled**
| Type | Boolean |
| ------- | ------- |
| Default | `true` |
This setting can be used to turn on or off all attributes for transaction traces. If `attributes.enabled` at the root level is `false`, no attributes will be sent to transaction traces regardless on how this property (`transaction_tracer.attributes.enabled`) is set.
**attributes.include**
| Type | List of strings |
| ------- | --------------- |
| Default | (none) |
If attributes are enabled for transaction traces, all attribute keys found in this list will be sent to New Relic in transaction traces. For more information, see the [agent attribute rules](https://docs.newrelic.com/docs/apm/other-features/attributes/agent-attributes).
**attributes.exclude**
| Type | List of Strings |
| ------- | --------------- |
| Default | (none) |
All attribute keys found in this list will not be sent to New Relic in transaction traces. For more information, see the [agent attribute rules](https://docs.newrelic.com/docs/apm/other-features/attributes/agent-attributes).
**token_limit**
| Type | Integer |
| ------- | ------- |
| Default | `3000` |
Limits the number of Tokens that can be created per Transaction. Increasing this value may impact performance, because it increases the amount of memory the agent uses and the amount of data sent to New Relic.
**segment_limit**
| Type | Integer |
| ------- | ------- |
| Default | `3000` |
Limits the number of segments that can be created per transaction. Increasing this value may impact performance, because it increases the amount of memory the agent uses and the amount of data sent to New Relic.