After setting up change tracking, you can analyze how deployments, feature flags, and other modifications impact your system performance. This page shows you how to access change tracking data, view changes across your system, and understand their impact on performance metrics.
For example, if something is wrong with your system, you can view all of the changes from your system in one place and correlate them with system performance metrics of your choice to quickly identify problematic changes.
Access change tracking
You can access change tracking data in New Relic through two main views, depending on your analysis needs.
Global view across all entities
The Change Tracking across all entities page displays a consolidated view of change events for all accounts and entities on one page. It enables you to:
- Review changes across all accessible accounts and entities.
- Filter change events by account, entity, deployment type, and other attributes to refine results.
- Add a timeseries query to visualize change events against timeseries data across various entities and accounts.
To access the global view:
Go to one.newrelic.com > All Capabilities > Change Tracking.
Tip
To add the Change Tracking page to your left navigation, click the pin icon.
The Change Tracking across all entities page displays the change events for all entities and accounts for which you have access. You can view these events in the two components:
Change events table: This table lists change events from your accessible accounts. Each event in the table is also marked on the time-series chart.
- To refine the list of change events shown, use the filter bar to select attributes such as account name, entity name, custom attributes, and more.
- Adjust the displayed time range using the time picker, or by clicking and dragging a selection directly on the chart.
Change events time-series chart: Run a NRQL query and view the results on this chart with change events overlaid. This visualization helps you correlate data trends (such as spikes or dips) with specific system changes across your accounts.
Tip
The chart and table can each display a maximum of 1,000 events. If your current filters and time range result in more than 1,000 events, only the 1,000 most recent events across all of the authorized accounts are shown. To view a more specific set of events (fewer than 1,000), apply a more restrictive filter or select a shorter time range.
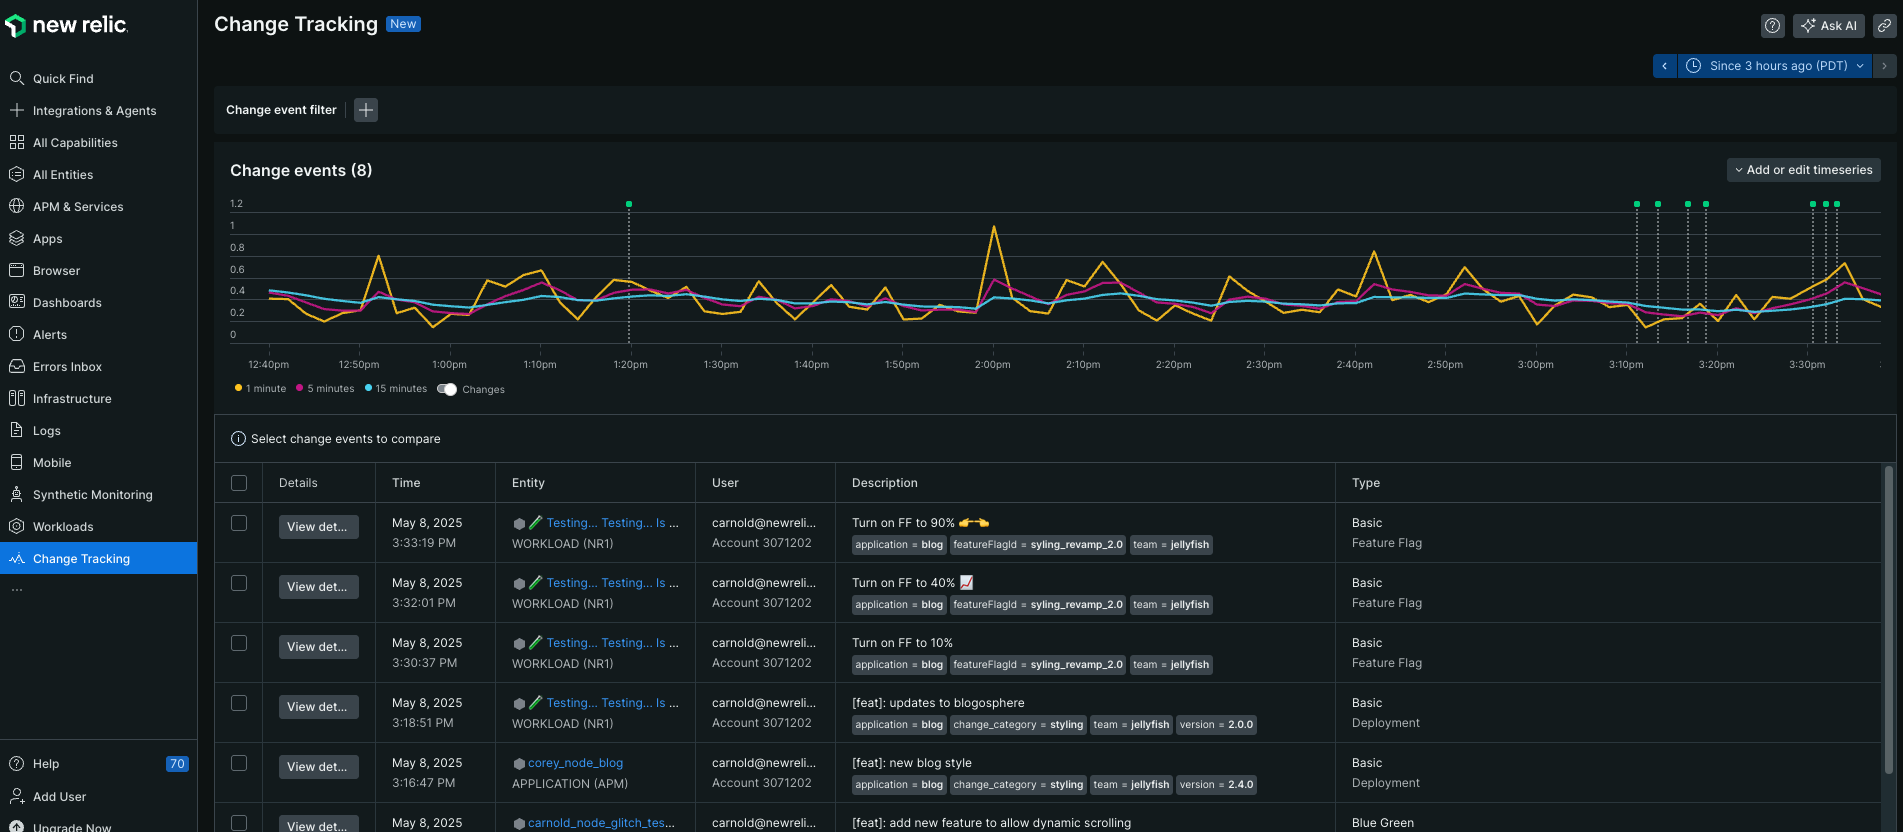
See how your changes are recorded across your estate
Preparing for the REST API end of life?
The New Relic Deployments v0 and v2 REST APIs reach end of life on July 31, 2027. If you record deployments through either of those REST APIs, use the approach below to find which of your existing changes came in through them (filter on newrelic.source LIKE 'api.rest%'), so you know what to migrate to NerdGraph before that date.
Every change tracking event records how it was created, so you can review the recording method and the calling client for all of your changes in one place — across every account and entity you have access to.
Every event records a newrelic.source attribute, which identifies which change tracking API was used to create the event:
| How the change was recorded |
|---|---|
| NerdGraph |
| NerdGraph |
| REST API v2 deployments endpoint ( |
| Legacy Deployments v0 API ( |
Alongside newrelic.source, change tracking records details about the client that made the call:
Attribute | Description | Example |
|---|---|---|
| A normalized value describing the code or tool that was detected to have sent the change event to New Relic. When the tool can't be determined, this is |
|
| A description of the telemetry that was used to determine |
|
| The underlying telemetry that |
|
| A normalized value describing the language of the tool that sent the change event, derived from |
|
Tip
The instrumentation.provider and instrumentation.source values are your best signal for identifying the calling integration, but they aren't definitive — many tools share a generic value (for example, curl or a popular HTTP library). Treat them as a hint that narrows down where to look in your own systems, not a guaranteed identification.
What you can use this for:
- Audit how changes are recorded: See which changes use NerdGraph (
changeTrackingCreateEventorchangeTrackingCreateDeployment) versus the REST APIs across all your entities and accounts — for example, to standardize on a single method. - Identify the tools recording changes: Use
instrumentation.providerandinstrumentation.sourceto see which CI/CD systems, scripts, or libraries are recording changes across your estate. - Check consistency across teams: Facet by
newrelic.sourceto see which recording method each entity or team uses — for example, to spot teams still recording through the REST APIs while others have moved to NerdGraph. - Verify a migration: After moving off the REST APIs, confirm no new changes are still arriving with an
api.rest.*source.
In the UI:
- Open the global view at one.newrelic.com > All Capabilities > Change Tracking.
- Add columns such as entity name,
newrelic.source,user,instrumentation.provider,instrumentation.name,instrumentation.source, andinstrumentation.languageso you can review each entry without opening it. - Use the filter bar to narrow the change events table — for example, filter on
newrelic.source LIKE 'api.rest%'to see only changes recorded through the REST APIs reaching end of life.
With NRQL:
Run this query in the query builder or through NerdGraph to see how changes are recorded across your estate, grouped by API and client:
FROM Deployment, ChangeTrackingEventSELECT count(*)FACET newrelic.source, instrumentation.provider, instrumentation.nameSINCE 3 months ago LIMIT MAXTo list the individual changes recorded through the REST APIs reaching end of life — with the caller's user agent, detected tool, and language — add the api.rest% filter:
FROM Deployment, ChangeTrackingEventSELECT entity.name, version, user, newrelic.source, instrumentation.name, instrumentation.provider, instrumentation.source, instrumentation.languageWHERE newrelic.source LIKE 'api.rest%'SINCE 3 months ago LIMIT MAXImportant
This discovery method finds usage of the deployment REST APIs only. Other REST API v2 endpoints (for example, metric data, hosts, or alerts) don't record a newrelic.source attribute, and New Relic can't audit which of your tools call them. To find that usage, search your codebase, CI/CD pipelines, and automation scripts for calls to api.newrelic.com/v2/ and api.eu.newrelic.com/v2/, as described in the end-of-life announcement.
Entity-specific view
The entity-scoped Change Tracking view displays change events for a specific entity, such as APM, browser, or mobile. It also offers additional information related to golden signals for each change event. You can also use provided filters to view specific change events for that entity.
To access entity-specific change tracking:
Go to one.newrelic.com > All Entities.
Tip
If you've opted for Catalogs, then instead of All Entities, you'll see Catalogs in the left navigation. Go to one.newrelic.com > Catalogs.
Select your required entity.
Click Change tracking in the left navigation.
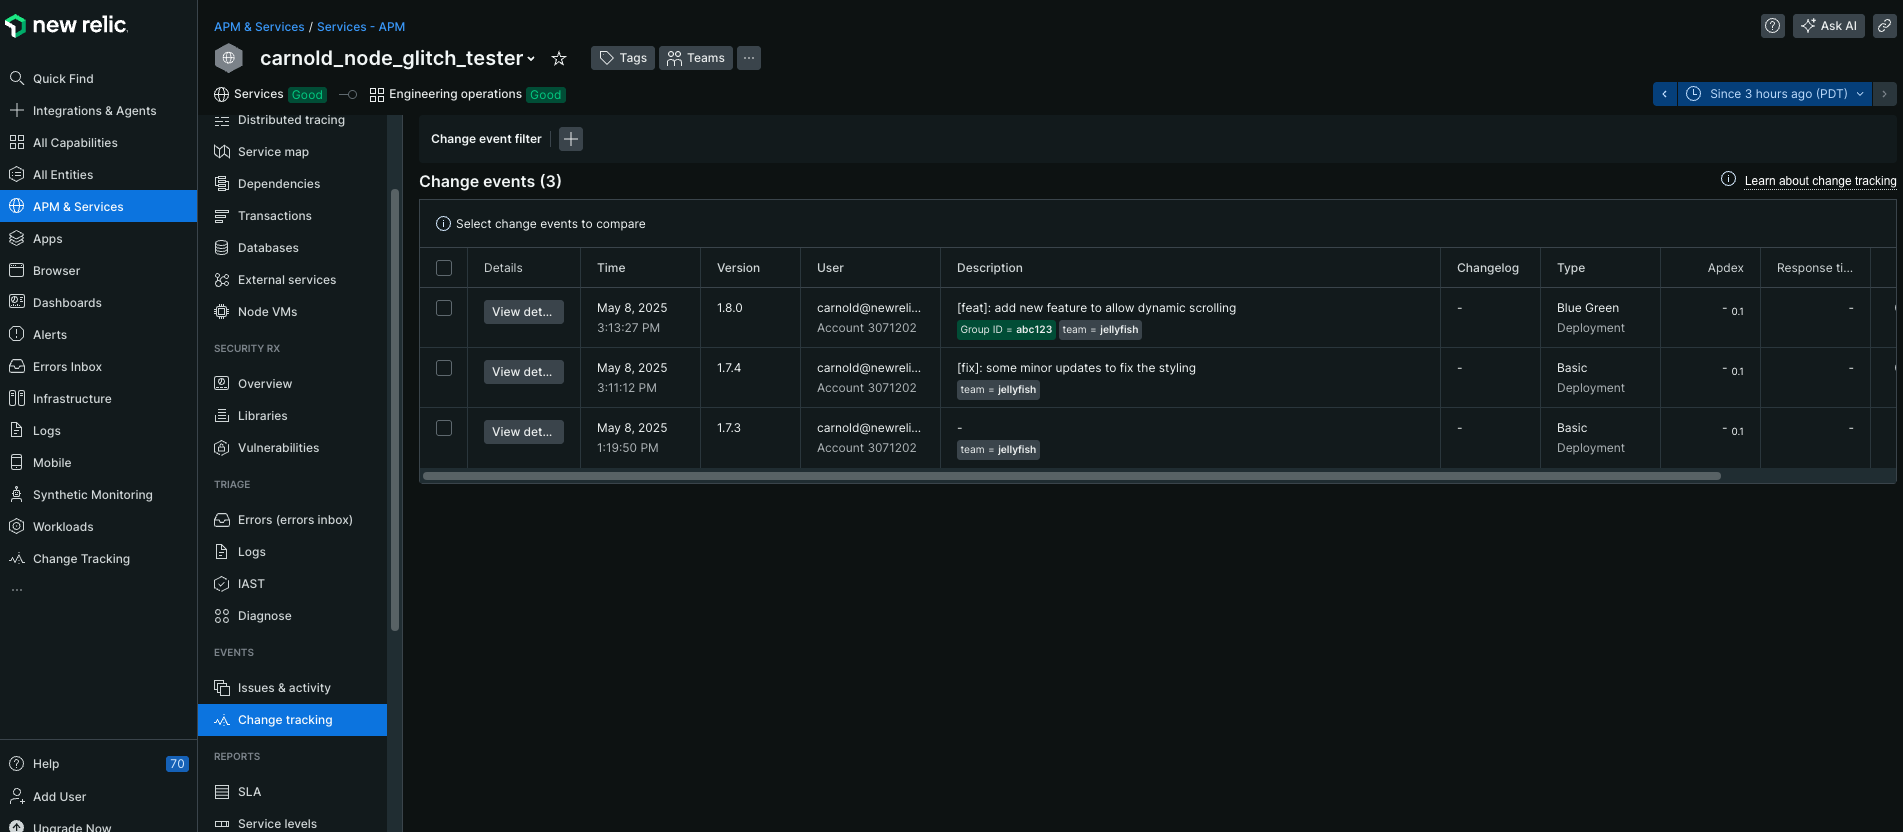
Tip
The entity view includes additional golden signal metrics and impact analysis specific to that entity type.
View your changes
Once you've set up change tracking, you can view change markers and events in several locations throughout New Relic.
In charts and dashboards
Change markers appear as vertical lines with pinheads on time-series charts across APM, browser, mobile, and custom dashboards. Click the pinhead to drill into the change's impact on entity health and performance.
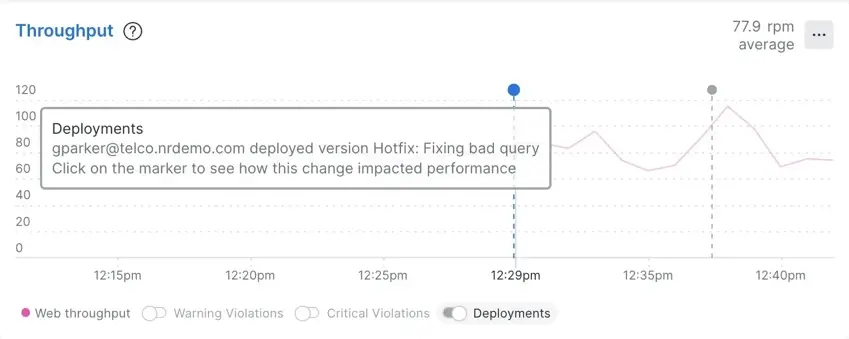
Tip
If you don't see expected markers, check your time picker selection—the change might be outside your current time window.
How markers are selected for charts
Charts display markers based on the underlying NRQL query and related entities:
- Direct entity specification: Charts show markers for entities explicitly mentioned in the query using
entity.guid,entityGuid,entity.name,entityName,appName, orservice.name - Related entities: Markers also appear for entities connected through these relationship types:
CALLS,SERVES,IS,CONTAINS,HOSTS
Important
NRQL queries are scoped to a single account. Charts can display up to 5,000 change events.
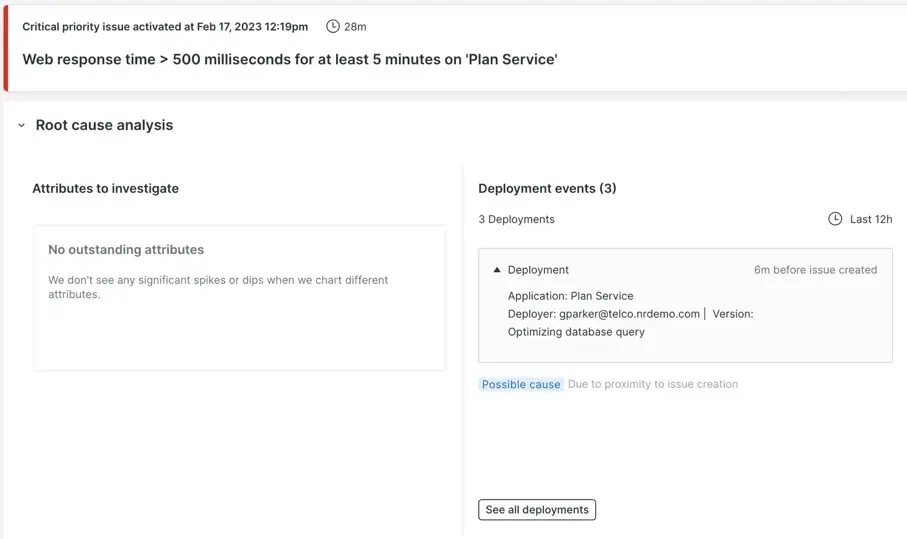
Analyze change impact
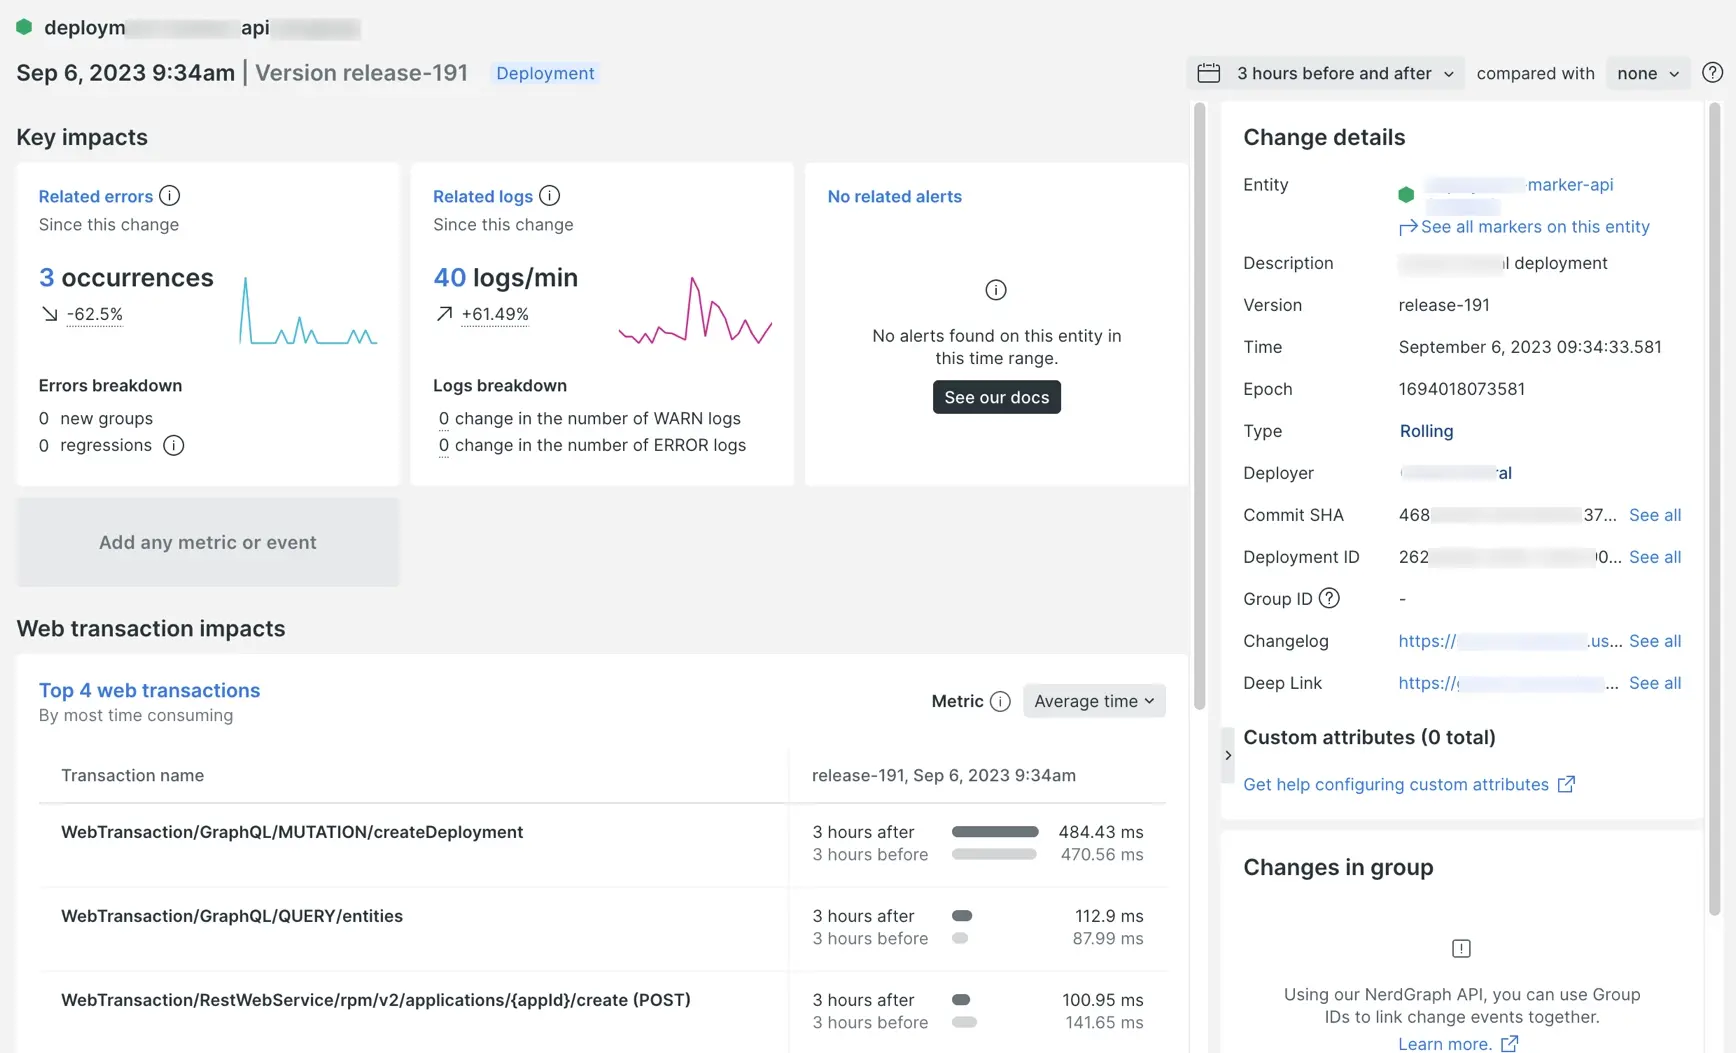
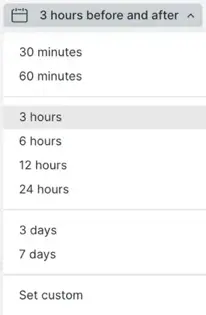
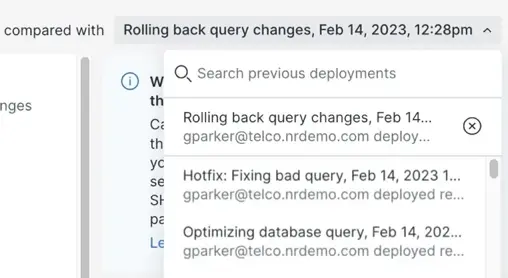
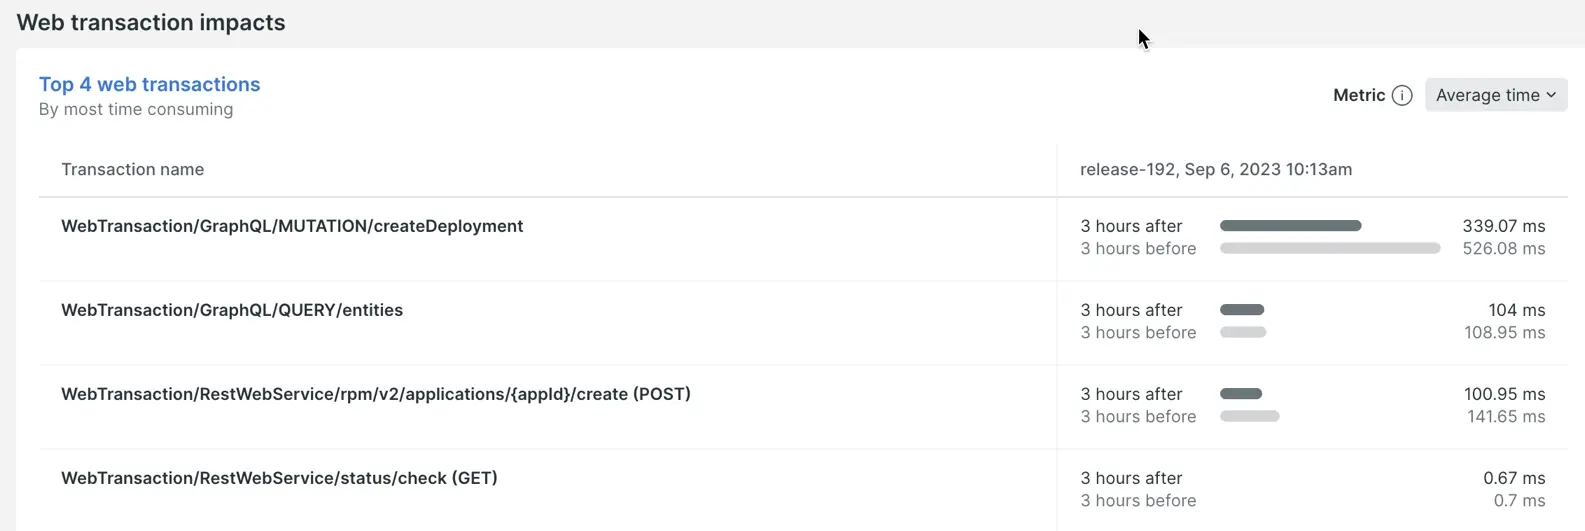
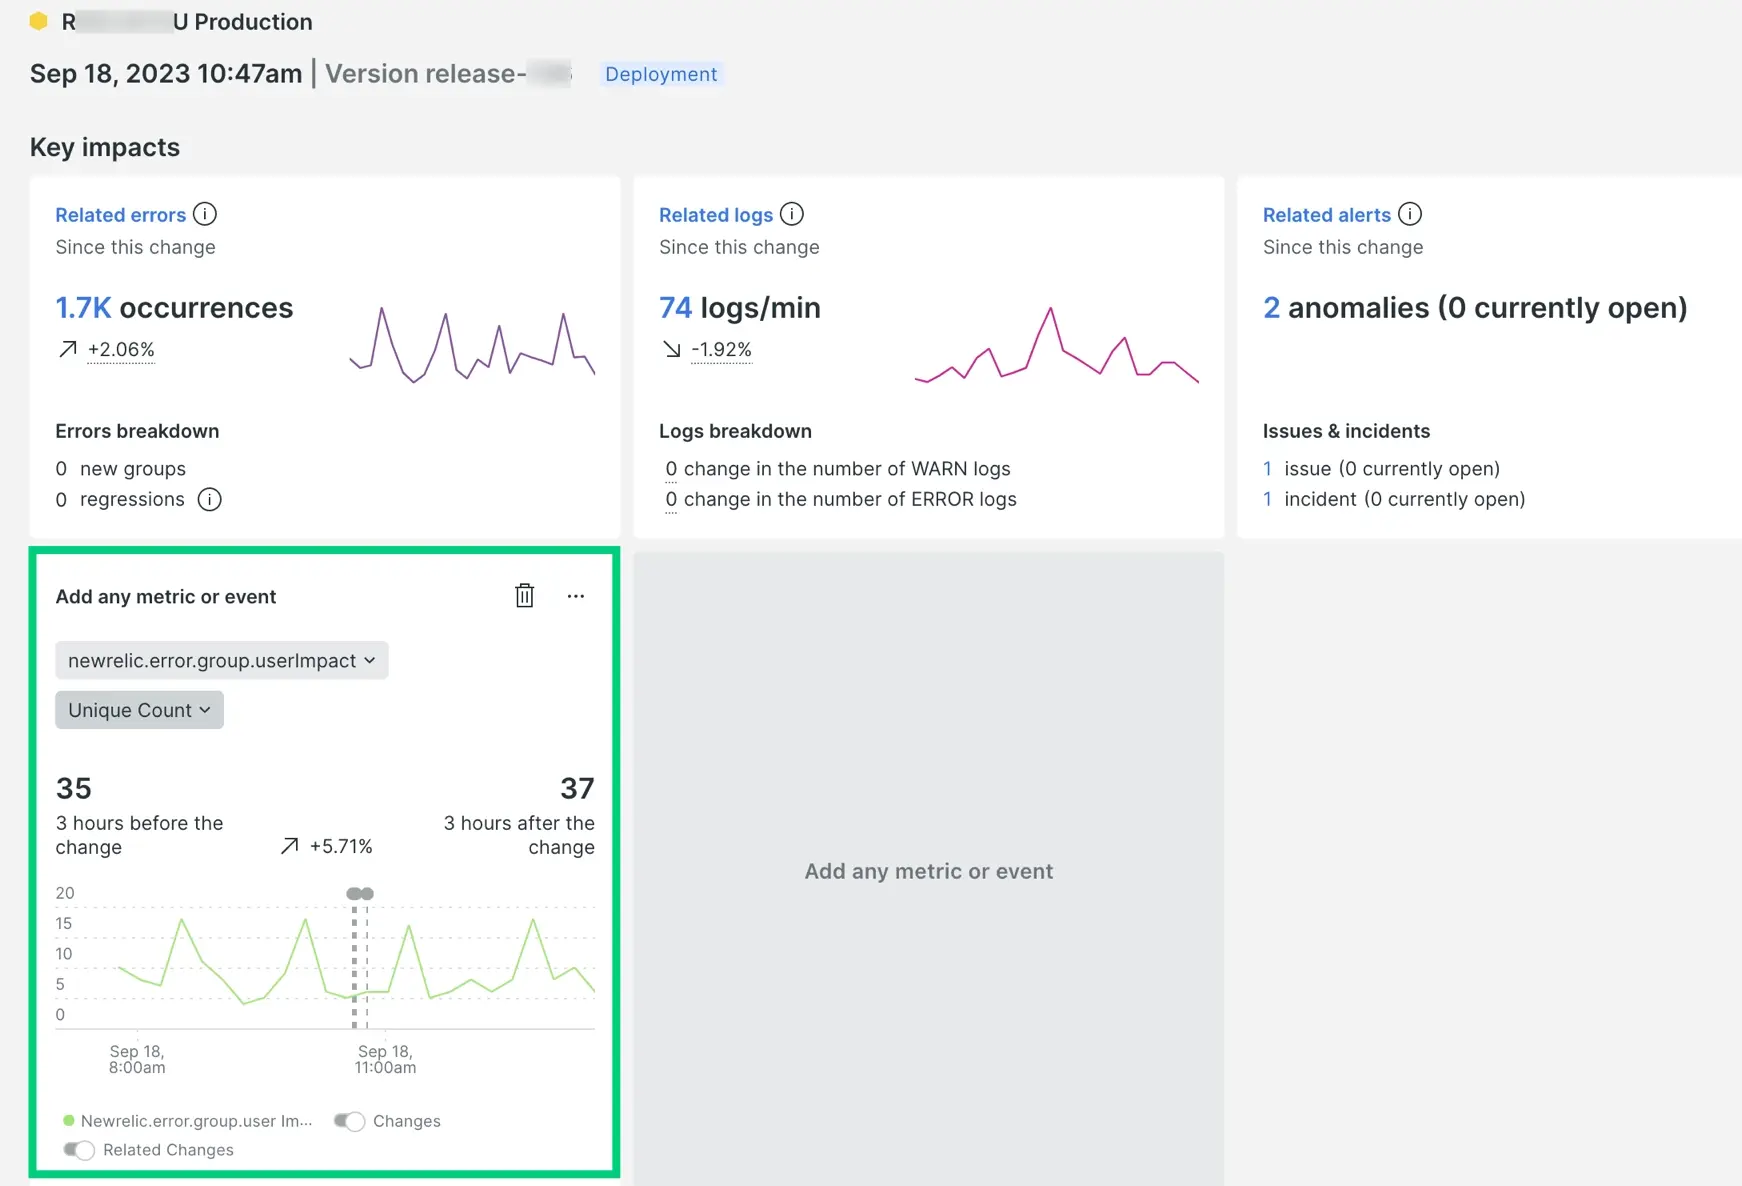
New Relic provides several tools to help you understand how changes affect your system performance and user experience.
Data retention and limits
Understanding data constraints helps you plan your analysis approach:
Data type | Retention |
|---|---|
Change events | 13-month retention period |
Chart markers | Up to 5,000 events per chart |
Change tracking tables | 1,000 events loaded by default |
Custom trend boards | Maximum of 3 per change |
Comparison views | Up to 5 stacked change comparisons |