---
title: New Relic Azure Monitor integration
source: https://docs.newrelic.com/docs/infrastructure/microsoft-azure-integrations/azure-integrations-list/azure-monitor
---
Monitor and report data about your Microsoft Azure services to New Relic with the New Relic Azure Monitor integration.
## Features [#features]
Our Azure monitor integration monitors all your metrics from supported Azure services. Once enabled, we query your Azure platform services according to your set polling interval. When that happens, you get:
- Metric ingestion from [many Azure services supported by Azure Monitor](https://learn.microsoft.com/en-us/azure/azure-monitor/essentials/metrics-supported).
- Native [dimensional metrics](https://docs.newrelic.com/docs/data-apis/understand-data/new-relic-data-types/#metrics-new-relic) experience for queries, alerts, and data explorer.
- Azure [entities](https://docs.newrelic.com/docs/new-relic-solutions/new-relic-one/core-concepts/what-entity-new-relic) in our [entity explorer](https://docs.newrelic.com/docs/new-relic-one/use-new-relic-one/ui-data/new-relic-one-entity-explorer) with golden metrics and built-in dashboards.
- Metrics decorated with custom tags defined in Azure resources.
- Faster [polling intervals](https://docs.newrelic.com/docs/infrastructure/microsoft-azure-integrations/getting-started/polling-intervals-azure-integrations) available (up to `1min`), enabling faster time-to-glass for metrics.
- Ability to filter monitored resources by group, type, and tags.
### The Azure Native New Relic Service [#azure-native]
This integration is what powers the Azure Native New Relic Service, a service that lets you set up and configure New Relic directly from the Azure portal and store your New Relic data in Azure. [Learn more about the Azure Native New Relic Service](https://docs.newrelic.com/docs/infrastructure/microsoft-azure-integrations/get-started/azure-native).
## Comparison to our older Azure solutions [#comparison]
Our Azure Monitor integration is an improvement upon our previous Azure integrations. For a detailed comparison and notes on migrating to the new integration, see [Migrate](#migrate).
## Requirements [#requirements]
Requirements for using the Azure Monitor integration:
- Have a New Relic account. Don't have one? [Sign up for free!](https://newrelic.com/signup) No credit card required.
- Create a New Relic application and key in Azure.
- Grant this application access to the Azure services you want to monitor.
- Place required information in the integrations UI.
- New Relic generated traffic for Azure Monitor integration doesn't use designated [IP addresses](https://docs.newrelic.com/docs/new-relic-solutions/get-started/networks/#webhooks). Don't set up filtering based on IP address when using Azure Monitor integration.
Note that this integration can also be used by setting up the [Azure Native New Relic Service](https://docs.newrelic.com/docs/infrastructure/microsoft-azure-integrations/get-started/azure-native).
## Cost considerations [#cost-considerations]
Here are some cost-related considerations when using the Azure Monitor integration:
**Microsoft Azure costs**
Given that the new integration enables ingesting all metrics from all services, **the amount of API calls to Azure will depend on the number of resources that are monitored by New Relic**. Configuration of the integration's polling interval parameters can help controlling the amount of these API calls.
For more detail, see the [Microsoft Azure Monitor pricing docs](https://azure.microsoft.com/en-in/pricing/details/monitor/#pricing).
> #### ⚠️ IMPORTANT
>
> Rate limits as enforced by Azure will be shared between any current polling integrations that exist from within other New Relic Azure integrations.
**New Relic costs**
Standard New Relic billing factors apply. For details, see [New Relic pricing](https://docs.newrelic.com/docs/accounts/accounts-billing/new-relic-one-pricing-billing/new-relic-one-pricing-billing).
## Enable the Azure monitor integration [#set-up]
Below are instructions for setting up the Azure Monitor integration from New Relic. Alternatively, you can use the [Azure Native New Relic Service](https://docs.newrelic.com/docs/infrastructure/microsoft-azure-integrations/get-started/azure-native), which uses this integration.
To enable the Azure Monitor integration:
1. Follow the instructions for [activating Azure integrations](https://docs.newrelic.com/docs/infrastructure/microsoft-azure-integrations/get-started/activate-azure-integrations).
2. Go to **[one.newrelic.com > All capabilities](https://one.newrelic.com/all-capabilities) > Infrastructure > Azure**, and look for the **Azure Monitor** integration.
3. Click **Configure**, and then toggle **Enabled** to **On**.
4. Review the [settings](#settings) and ensure you're okay with them.
It can take a few minutes for data to show up.
Once you activate the integration, we recommend:
- Start by validating and testing the new integration on testing environments first.
- Review the [integration settings](#settings) section to adjust polling intervals and filters based on your observability requirements.
- If you were a user of our [older Azure integrations](#migrate), start with those resource types that we didn't previously support.
The Azure Monitor integration and other Azure integrations can be enabled in parallel. See the [querying your data](#Querying-Your-Data) section to learn how to query Azure Monitor metrics in isolation.
## Integration settings [#settings]
Polling frequency details for the Azure Monitor integration:
- `Metrics polling interval`: how often we fetch metrics from your resources.
- `Metadata and tags polling interval`: how often we fetch metadata and tags from your resources.
Data collection and filters:
- `Limit to resource types`: only fetch data from resources matching specified resource types (if enabled and not empty)
- `Limit to resource group`: only fetch data from resources matching specified resource groups (if enabled and not empty)
- `Resource tags to include`: only fetch data from resources tagged with specified tags (if enabled and not empty)
- `Resouce tags to exclude`: drop data from resources tagged with specified tags (highest precedence)
## Feature details [#support]
Here are some details on this integration's features:
**Querying your data**
Metrics collected using the Azure Monitor:
- Are stored in New Relic as [dimensional metrics](https://docs.newrelic.com/docs/data-apis/understand-data/new-relic-data-types/#dimensional-metrics), with the type `summary`.
- Can be queried using [NRQL](https://docs.newrelic.com/docs/query-your-data/nrql-new-relic-query-language/get-started/introduction-nrql-new-relics-query-language).
- Are available as raw dimensional metrics when not mapped to an entity.
If you're migrating to the Azure Monitor integration from our traditional integrations, you can continue to use the queries and metric naming from those integrations.
All Azure monitor metrics have these attributes:
- `collector.name`: `azure-monitor`
- `instrumentation.provider`: `azure`
- `azure.region`
- `azure.resourceId`
- `azure.resourceType`
- `azure.resourceId`
For example, to see the amount of metric updates received from Azure Monitor in the last hour, run this query:
```sql
FROM Metric SELECT count(*) WHERE collector.name = 'azure-monitor' TIMESERIES SINCE 1 hour ago
```
Currently, custom metrics are not supported by the Azure Monitor integration.
**Alert conditions**
You can create [NRQL alert conditions](https://docs.newrelic.com/docs/alerts-applied-intelligence/new-relic-alerts/alert-conditions/create-nrql-alert-conditions) on Azure Monitor integration metrics.
Make sure your filter limits data to metrics from only the Azure Monitor integration. For example:
````sql
FROM Metric
SELECT max(`azure.storage.storageaccounts.SuccessServerLatency`)
WHERE collector.name = 'azure-monitor'
FACET azure.region, azure.resourceId
```
Then, to make sure that our alerting service processes the data correctly, configure the advanced signal settings. These settings are needed because Azure Monitor receives metrics from services with a certain delay.
To configure the signal settings, under **Condition Settings**, click on **Advanced Signal Settings** and enter the following values:
* **Aggregation window**: With a one minute aggregation window, we recommend setting an eight minute evalaution offset.
For more details, see [How to create NRQL alerts](/docs/alerts-applied-intelligence/new-relic-alerts/alert-conditions/create-nrql-alert-conditions).
````
**Entities**
A partial list of entities are available as part of the public preview. You can create custom dashboards and alerts on top of new metrics.
We expect to cover feature-parity and have all entities from the 30 Azure services we have today and will continue adding support for more services over the next few months.
List of services that create entities:
- Azure App Service Plans
- Azure Flexible DB for MySQL
- Azure Flexible DB for PostgreSQL
- Azure Functions Apps
- Azure Load Balancer
- Azure Redis Cache
- Azure Storage Accounts
- Azure SQL Databases
- Azure SQL Elastic Pools
- Azure Service Bus Namespaces
- Azure Virtual Machines
- Azure Virtual Networks
- Azure Virtual Networks Network Interfaces
- Azure Virtual Networks Public IP Address
- Azure API Management
- Azure App Gateways
- Azure Containers
- Azure Data Factory
- Azure Event Hubs
- Azure Express Routes
- Azure Firewalls
- Azure Frontdoors
- Azure Key Vaults
- Azure Logic Apps
- Azure Machine Learning Services
- Azure PowerBI Dedicated
- Azure SQL Managed Instances
- Azure VM Scalesets
- Azure VPN Gateways
## Migrate to the Azure Monitor integration [#migrate]
Our Azure monitor integration improves upon our past Azure solutions:
- Coverage: New metrics will be available the moment Azure adds it to their Azure Monitor API endpoints, including data from new Azure services.
- Always up-to-date: Any improvement in existing metrics will show up in New Relic automatically.
- Faster metrics: The new integration enables customers to define up to one polling interval reducing the average time-to-ingest for most Azure Monitor namespaces.
Before the Azure Monitor integration, monitoring Azure required service-specific Azure APIs to retrieve metrics and metadata. In contrast, the new Azure Monitor integration retrieves all [available Azure monitor metrics](https://learn.microsoft.com/en-us/azure/azure-monitor/essentials/metrics-supported), enhancing our Azure support and accelerating the availability of new Azure services and metrics.
The following table shows the differences between both solutions:
| Traditional Azure integrations | New Azure Monitor integration |
| ------------------------------------------------------------------------------------------- | -------------------------------------------------------------------------------------------------------------------------------------------------------- |
| A separate integration with each Azure service is required to collect metrics and metadata. | Our single Azure Monitor integration is able to collect metrics and metadata from a large and ever-growing list of resources supported by Azure monitor. |
| Adding support for new Azure services requires building and maintaining a new integration. | Data from new services supported by the Azure monitor is available in New Relic at once. |
| Minimum metric polling interval: 5 min. | Minimum metric polling interval: 1 min. |
When migrating from our traditional Azure integrations to the Azure Monitor integration, here are a couple things to keep in mind:
- When you enable an Azure Monitor integration, new separate entities will be created for all of your resources. The entities created by the Azure Polling integration are staying as they are. This means you must update dashboards, alerts, and any other capability that refrences those entities.
- Old entities are available for 24 hours.
- A metric name may appear twice when the metric has different dimension combinations. You can prevent duplicate metric names by [creating a query that filters aggregations of your data](https://docs.newrelic.com/docs/infrastructure/microsoft-azure-integrations/get-started/azure-integration-metrics/#metrics-with-many-dimension-combinations).
## Migration steps from previous Azure Polling integrations [#migration-from-polling]
On a typical deployment, migrating from Azure API polling to the Azure monitor involves the following steps. We recommend trying this on a development or staging environment first to minimize any potential issues that may arise.
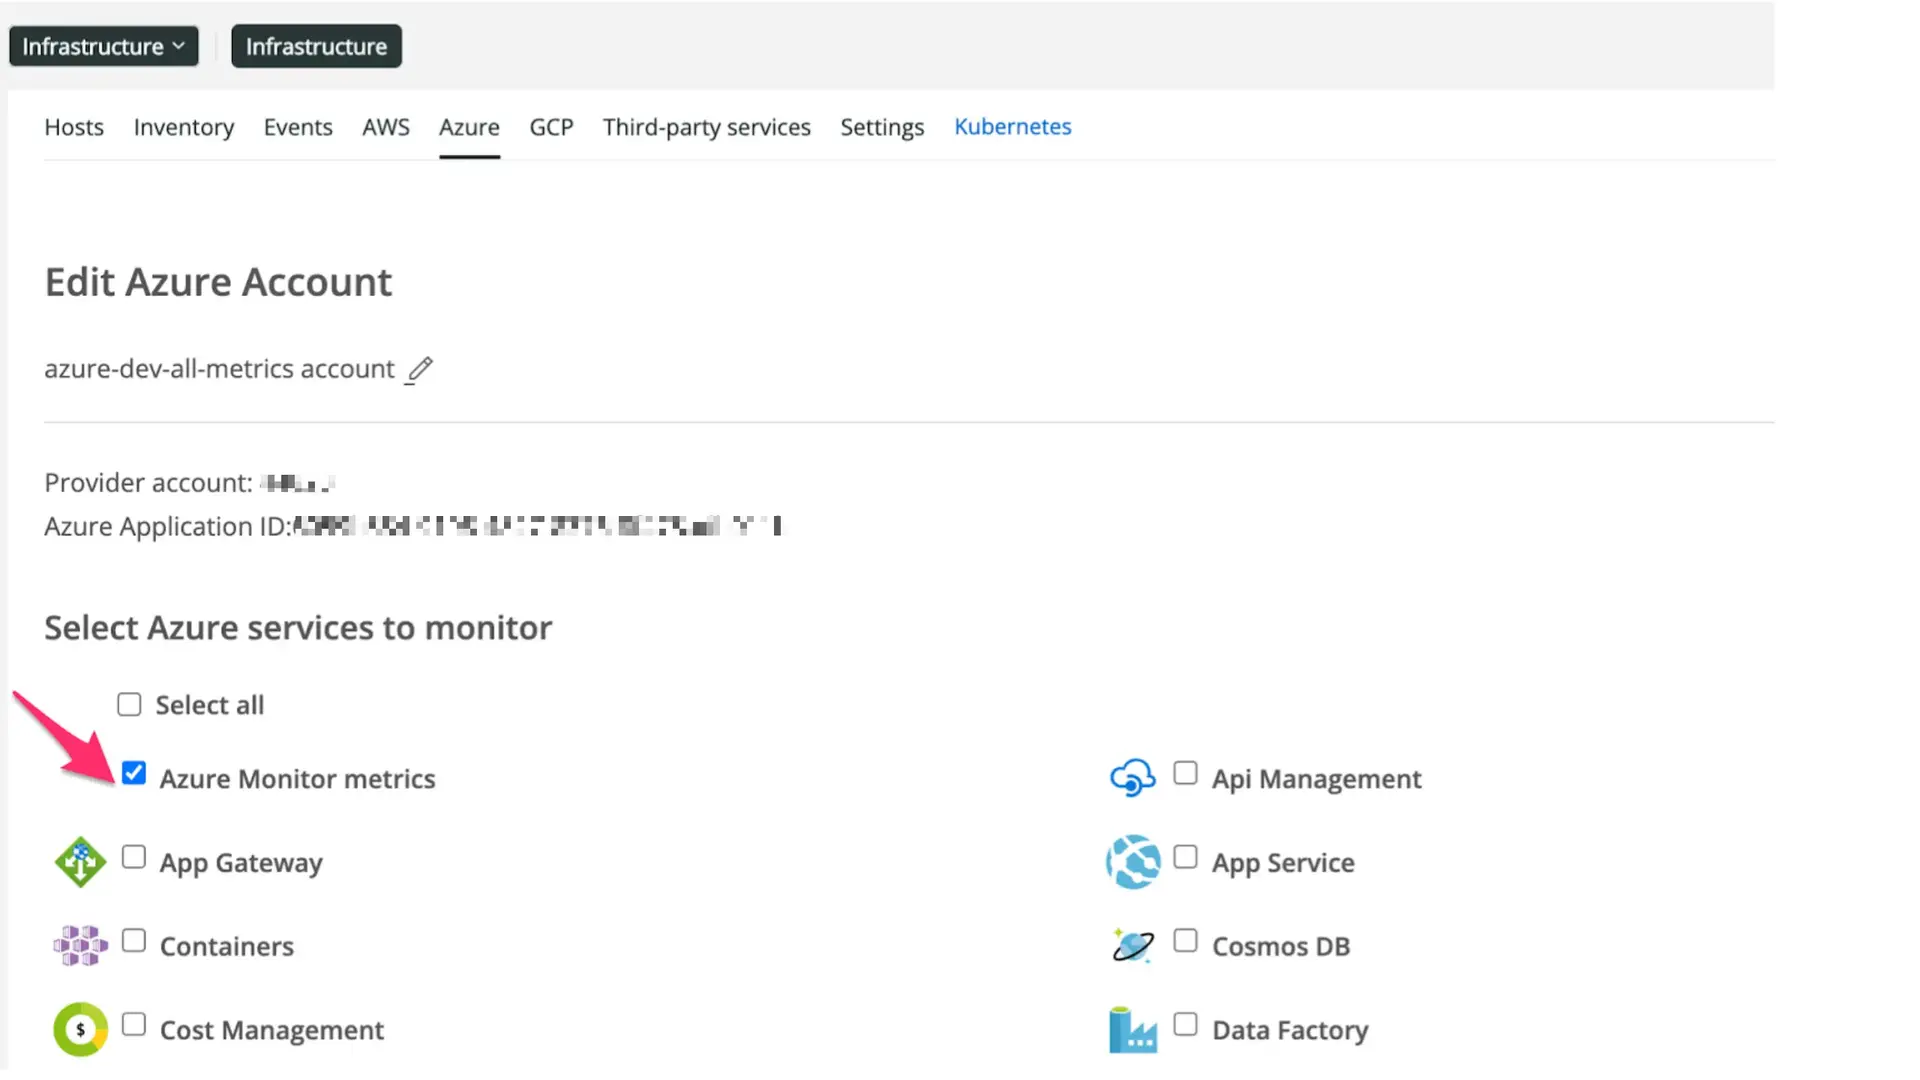
1. Go to **[one.newrelic.com > All capabilities](https://one.newrelic.com/all-capabilities) > Infrastructure > Azure**, then click **Manage Services**.
2. Enable the new **Azure Monitor metrics** integration and click **Save Changes**.

3. The **Azure Monitor metrics** integration becomes available.

4. Enable and configure the new integration.

5. Once the setup is done, you can disable the previous polling integrations under the **Manage services** settings.
> #### ⚠️ IMPORTANT
>
> If both integrations are enabled for the same resource type, you may see duplicate metrics. This can happen if you use a generic name field to filter your results that can be shared from the Azure monitor and the Azure Polling integrations. The results from multiple resources could be joined unintentionally.
>
> Note that metrics can still be differentiated by faceting using the field `collector.name`. `collector.name` may not always be available on an API polling resource, and its absence is an indication of no Azure monitor coverage. Also note that rate limits as enforced by Azure will be shared between any current polling integrations and the Azure monitor.