---
title: StatsD monitoring integration
source: https://docs.newrelic.com/docs/infrastructure/other-infrastructure-integrations/statsd-monitoring-integration
---
Our StatsD integration lets you easily get [StatsD](https://github.com/statsd/statsd)-format data into New Relic. You can also add any arbitrary tags (key-value pairs) to your data. Once your metrics are in New Relic, you can [query your data](#find-use-data) and create custom charts and dashboards.
Want to try out our StatsD integration? [Create a New Relic account](https://newrelic.com/signup) for free! No credit card required.
## Requirements
This integration uses our [Metric API](https://docs.newrelic.com/docs/data-ingest-apis/get-data-new-relic/metric-api/introduction-metric-api) and our [Event API](https://docs.newrelic.com/docs/insights/insights-data-sources/custom-data/introduction-event-api) to ingest data. To use these APIs, you'll need a license key.
The integration adheres to the Metric API [requirements and data limits](https://docs.newrelic.com/docs/data-ingest-apis/get-data-new-relic/metric-api/metric-api-limits-restricted-attributes). To see if you might be hitting the rate limit, run the following NRQL query of the [`NrIntegrationError` event](https://docs.newrelic.com/docs/telemetry-data-platform/manage-data/nrintegrationerror):
```sql
SELECT count(*) FROM NrIntegrationError
WHERE newRelicFeature = 'Metrics'
FACET category, message
LIMIT 100 SINCE 1 day ago
```
The integration is available as a linux container image in [DockerHub](https://hub.docker.com/r/newrelic/nri-statsd/tags) for amd64 and arm64 architectures.
## Install
This section will explain how to do a standard install. If you want to run StatsD in Kubernetes, see [Kubernetes install](#kubernetes).
To install the StatsD integration, run the following command and include your [New Relic account ID](https://docs.newrelic.com/docs/accounts/install-new-relic/account-setup/account-id) and license key. This generates a TOML configuration file used by `gostatsd`.
```shell
docker run \
-d --restart unless-stopped \
--name newrelic-statsd \
-h $(hostname) \
-e NR_ACCOUNT_ID=YOUR_ACCOUNT_ID \
-e NR_API_KEY=NEW_RELIC_LICENSE_KEY \
-p 8125:8125/udp \
newrelic/nri-statsd:latest
```
If your organization is in the [EU data center region](https://docs.newrelic.com/docs/using-new-relic/welcome-new-relic/get-started/introduction-eu-region-data-center), add this to the above command:
```shell
-e NR_EU_REGION=true \
```
After installing, you can:
- Do optional [additional configuration](#configure)
- [Define your metrics](#metric-format)
- [Add custom tags](#add-tags) to your data
- [Create alerts](#alerts)
### Install for Kubernetes [#kubernetes]
Here are examples of Kubernetes manifests for deployment and service objects:
**Kubernetes manifest examples**
Below are examples of Kubernetes manifests to deploy StatsD in a Kubernetes environment and create a StatsD service named `newrelic-statsd`. You need to insert your [account ID](https://docs.newrelic.com/docs/accounts/install-new-relic/account-setup/account-id) and your license key.
**deployment.yml**:
````yml
apiVersion: apps/v1
kind: Deployment
metadata:
name: newrelic-statsd
namespace: tooling
labels:
app: newrelic-statsd
spec:
selector:
matchLabels:
app: newrelic-statsd
replicas: 2
revisionHistoryLimit: 2
template:
metadata:
labels:
app: newrelic-statsd
spec:
serviceAccountName: newrelic-statsd
containers:
- name: newrelic-statsd
image: newrelic/nri-statsd:latest
env:
- name: NR_ACCOUNT_ID
value: "NEW_RELIC_ACCOUNT_ID"
- name: NR_API_KEY
value: "NEW_RELIC_LICENSE_KEY"
```
**service.yml**:
```yml
apiVersion: v1
kind: Service
metadata:
name: newrelic-statsd
namespace: tooling
labels:
app: newrelic-statsd
spec:
type: ClusterIP
ports:
- name: newrelic-statsd
port: 80
targetPort: 8125
protocol: UDP
selector:
app: newrelic-statsd
```
**service-account.yml**:
```yml
apiVersion: v1
kind: ServiceAccount
metadata:
name: newrelic-statsd
namespace: default
```
For configuration details, see [Kubernetes configuration](#k8s-config).
````
**Kubernetes Helm Chart**
A [StatsD Helm chart](https://github.com/newrelic/helm-charts/tree/master/charts/nri-statsd) is also available to install the integration.
## Configure
In the [install procedure](#install), you run `nri-statsd` with environment variables, and this generates a TOML configuration file. Additionally, you can set these configuration options:
| Configuration options | Description |
| -------------------------------------- | ---------------------------------------------------------------------------------------------------------------------------------------------------------------------------------------------------------------------------------------------------------------------------- |
| `expiry-interval` _string_ | If a metric is not updated for this amount of time, we stop reporting that metric. Default is `5m`. If you want to send the metrics only if the value was updated between the flush intervals, configure this to `1ms`. To never expire metrics, set it to `0`. |
| `percent-threshold` _list of integers_ | Specifies the percentiles used for metrics aggregation. Default: `90`. |
| `metrics-addr` _string_ | Indicates address on which to listen for metrics. Default: `:8125`. From nri-statsd `v2.3.0` (goStatsD `v34.2.1`), connection via Unix Domain Socket (UDS) is supported. Use `metrics-addr=/some/path/newrelic-statsd.socket` instead of `[host]:port` in the configuration. |
> #### 💡 TIP
>
> To ensure FedRAMP compliance when using the StatsD integration you must define the following endpoints in the custom configuration:
>
> ```ini
> address = 'https://gov-insights-collector.newrelic.com/v1/accounts/$NR_ACCOUNT_ID/events'
> ```
>
> ```ini
> address-metrics = 'https://gov-infra-api.newrelic.com/metric/v1'
> ```
Here are some examples of customizing configuration by overwriting the default configuration:
**Example of custom configuration**
````ini
# Specify after how long do we expire metrics, default:5m
expiry-interval = '1ms'
# percent-threshold specify a list of percentiles for metrics aggregation, default:90
percent-threshold = [90, 99]
backends='newrelic'
[newrelic]
# flush types supported: metrics, insights, infra
flush-type = 'metrics'
transport = 'default'
address = 'https://insights-collector.newrelic.com/v1/accounts/$NR_ACCOUNT_ID/events'
address-metrics = 'https://metric-api.newrelic.com/metric/v1'
api-key = 'NEW_RELIC_LICENSE_KEY'
```
**Disable timer sub-metrics:**
By default, `nri_statsd` calculates the following for timer metrics: standard deviation, mean, median, sum, lower, and upper bounds for the flush interval. If you want to disable those metrics you can do it by adding a `disabled-sub-metrics` configuration section and set `true` for the ones you want disabled. Here's an example:
```ini
# disabled-sub-metrics configuration section allows disabling timer sub-metrics
[disabled-sub-metrics]
# Regular metrics
count=false
count-per-second=false
mean=false
median=false
lower=false
upper=false
stddev=false
sum=false
sum-squares=false
# Percentile metrics
count-pct=false
mean-pct=false
sum-pct=false
sum-squares-pct=false
lower-pct=false
upper-pct=false
```
````
**Docker: overwrite default configuration**
To overwrite the default `nri-statsd` configuration while running in a container, you can mount a configuration file inside the container.
You can adopt the following template as needed for your situation.
Example:
````ini
backends='newrelic'
flush-interval='10s'
[newrelic]
# flush types supported: metrics, insights, infra
flush-type = 'metrics'
transport = 'default'
address-metrics = 'https://metric-api.newrelic.com/metric/v1'
api-key = 'NEW_RELIC_LICENSE_KEY'
```
To run the container with the file mounted in the appropriate path:
```shell
docker run \
... \
-v ${PWD}/nri-statsd.toml:/etc/opt/newrelic/nri-statsd.toml \
... \
newrelic/nri-statsd:latest
```
````
**Kubernetes: overwrite default configuration**
The best approach to configure `nri-statsd` running in Kubernetes is to use a `configMap` and mount the `configMap` into the container. (This is a similar process to mounting the configuration file in Docker.)
Example:
````yml
apiVersion: v1
kind: ConfigMap
metadata:
name: nri-statsd-config
namespace: default
data:
nri-statsd.toml: |
backends='newrelic'
flush-interval='10s'
[newrelic]
# flush types supported: metrics, insights, infra
flush-type = 'metrics'
transport = 'default'
address = 'https://metric-api.newrelic.com/metric/v1'
api-key = '$NEW_RELIC_LICENSE_KEY'
```
To use the configMap, declare a volume on your deployment spec template and then declare a `volumeMount` on your container spec.
Example:
```yml
apiVersion: apps/v1
kind: Deployment
spec:
template:
spec:
containers:
# ....
volumeMounts:
- mountPath: /etc/opt/newrelic/
name: nri-statsd-config
volumes:
- name: nri-statsd-config
configMap:
name: nri-statsd-config
```
````
## Metric format
The integration receives metrics using the [StatsD protocol](https://github.com/statsd/statsd). Optionally, the sample rate can be configured and tags can be added.
Here's the metric data format we use:
```
:||@|#
```
Here are explanations of these fields:
| Field name | Description |
| ------------------------ | ------------------------------------------------------------------------------------------------------------------------------------------------------------------------------------------------------------------------------------------------------------------------------------------------------------------------------------------------------ |
| `` _string_ | **Required.** Name of the metric. |
| `` _string_ | **Required.** The [metric type](#metric-types): - `c` = counter - `g` = gauge - `ms` = timer |
| `@` _float_ | **Optional** for simple counters or timer counters. When many metrics must be sent, you can use sampling to reduce network traffic. The downside is a reduction in the resolution of the data. An example of how this would work for sample rates below `1`: If you set this to `0.1`, the counter would send a measurement one out of every 10 times. |
| `#` _string_ | **Optional.** Tags attached to your metrics are converted into attributes (key-value pairs). For more on tagging options, see [Tags](#add-tags). |
## Metric types
Here are the types of metrics and how to format them:
**Counter**
A counter measures the number of occurrences of an event. Examples include cache hits per reporting interval and the number of threads created per reporting interval.
A counter can be incremented or decremented during the same flush interval by adding a sign to the value. In the following example, the counter value will be `2`:
````
counter:4|c
counter:-2|c
```
At each flush, the current count is sent and reset to `0`. If the count is not updated, at the next flush it will send the value `0`. You can opt to disable this behavior by setting [`expiry-interval`](#configure) to `1ms`.
Here’s an example of a counter that is being sampled 1 out of 10 times:
```
counter:4|c@0.1
```
````
**Gauge**
A gauge represents a value that can increase or decrease with time. Examples of gauges include temperature, CPU usage, and memory. Here's an example:
````
temperature:40|g
```
If the gauge is not updated, at the next flush it will send the previous value. You can opt to disable this behavior by setting [`expiry-interval`](#configure) to `1ms`.
````
**Timer**
The timer metric type measures timing data.
By default, `nri_statsd` calculates the following for timer metrics: standard deviation, mean, median, sum, lower, and upper bounds for the flush interval. These are sent as sub-metrics in the following format:
````
.std_dev
.median
.summary
.sum_squares
.mean
.per_second
```
The configured percentiles will generate the following metrics. The percentile threshold value will be attached as a tag.
```
.sum_squares.percentiles
.sum.percentiles
.count.percentiles
.upper.percentiles
.mean.percentiles
```
The percentile threshold can be tweaked with the [`percent-threshold`](#configure) config option. These can be controlled through the [`disabled-sub-metrics` configuration section](#config-example).
````
## Add tags (attributes) [#add-tags]
You can add tags to your data, which we save as [attributes](https://docs.newrelic.com/docs/using-new-relic/welcome-new-relic/get-started/glossary#attribute) (key-value pairs). There are two options for adding tags:
- Add default tags that apply to all metrics: These apply to all metrics. They are fixed and don't change over time.
- Add metric-level tags: These apply to specific metrics and allow the value to be changed between two submits.
**Add default tags that apply to all metrics**
Add tags to metrics and events by defining an environment variable in the [startup command](#install).
Here's an example that would create two tags:
````sh
-e TAGS="environment:production region:us"
```
Here's that environment variable used in the [startup command](#install):
```sh
docker run \
-d --restart unless-stopped \
--name newrelic-statsd \
-h $(hostname) \
-e NR_ACCOUNT_ID=YOUR_ACCOUNT_ID \
-e NR_API_KEY=NEW_RELIC_LICENSE_KEY \
-e TAGS="environment:production region:us" \
-p 8125:8125/udp \
newrelic/nri-statsd:latest
```
````
**Add metric-level tags**
When defining the [metric format](#metric-format), you can add tags using this format:
````
:||#
```
In this example, `` is a comma-separated list of tags. Tags format is: `simple` or `key:value`.
````
Here's an example [NRQL](https://docs.newrelic.com/docs/query-data/nrql-new-relic-query-language/getting-started/introduction-nrql) query that includes a custom tag:
```sql
SELECT count(*) FROM Metric WHERE environment = 'production'
```
## Create alerts [#alerts]
You can alert on StatsD data using [NRQL alert conditions](https://docs.newrelic.com/docs/alerts/new-relic-alerts/defining-conditions/create-alert-conditions-nrql-queries).
**Alert example**
This procedure walks you through sending some sample data and then creating an alert condition using that data.
First, send this data to New Relic’s StatsD container:
````sh
echo "prod.test.num:32|g" | nc -v -w 1 -u localhost 8125
```
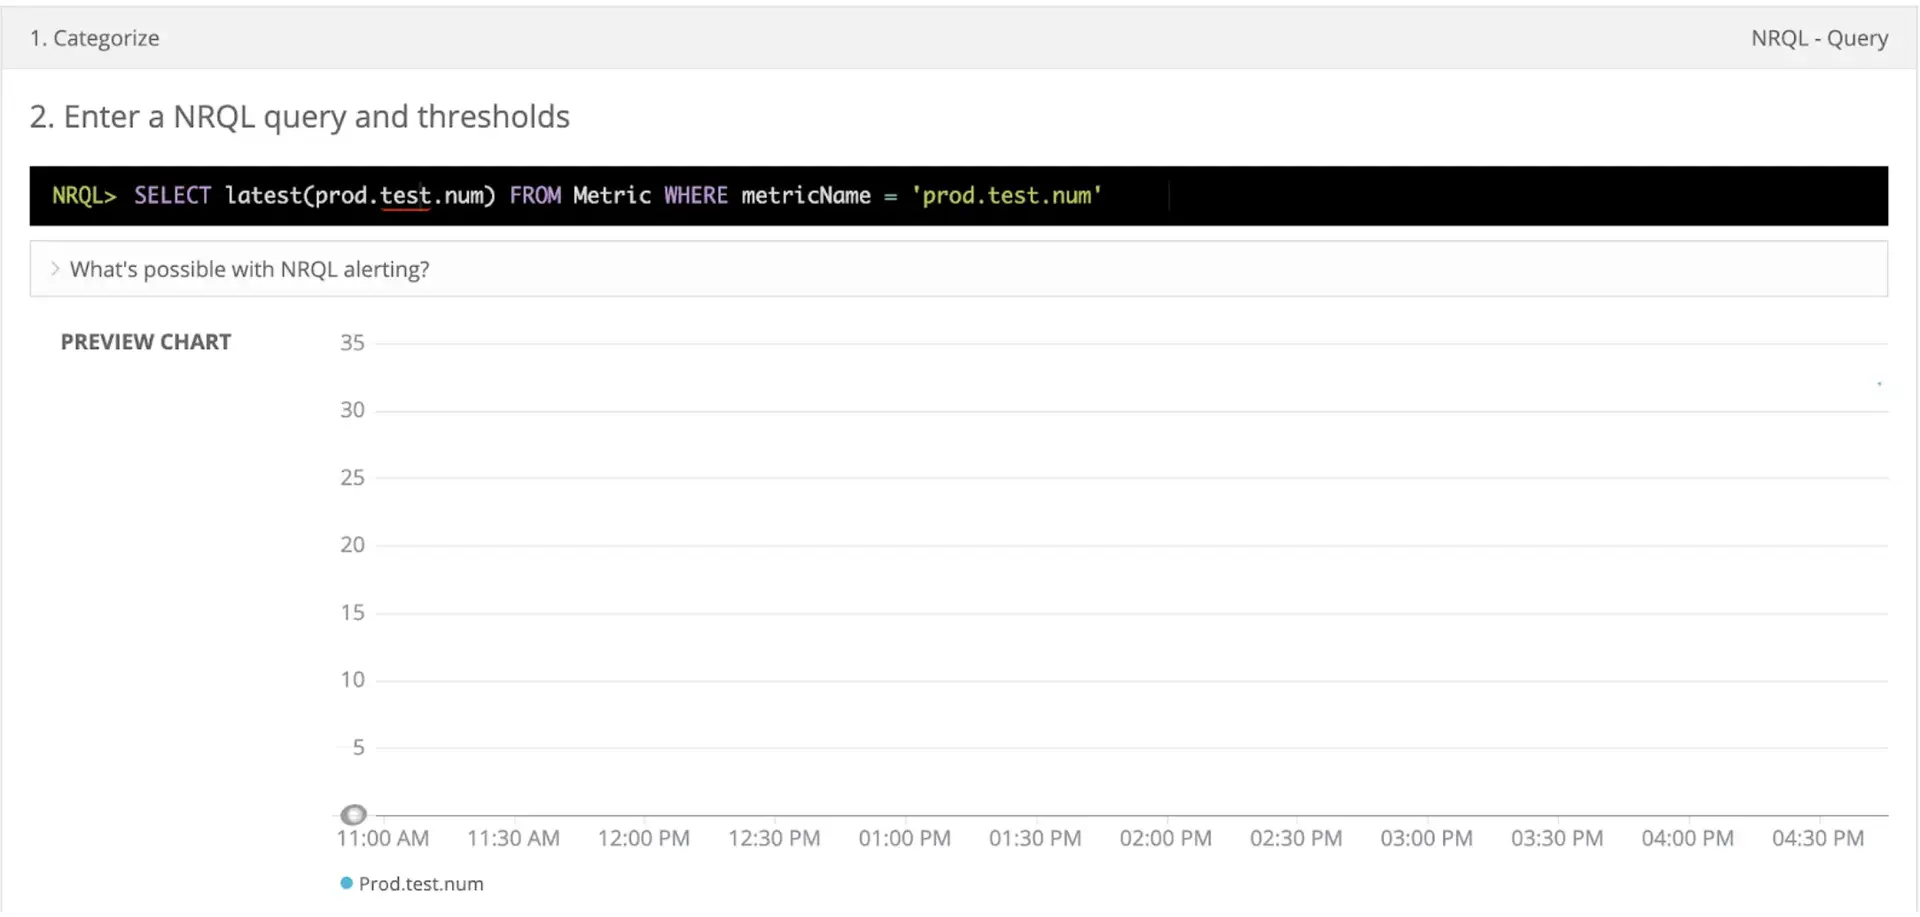
Next, create a [NRQL alert condition](/docs/alerts/new-relic-alerts/defining-conditions/create-alert-conditions-nrql-queries) using this query:
```sql
SELECT latest(prod.test.num) FROM Metric WHERE metricName = 'prod.test.num'
```
Here's an image showing creating this NRQL alert condition. Notice that the sample data sent in is represented by the blue dot on the upper right of the chart.
 Now we can create the alert condition with these settings:
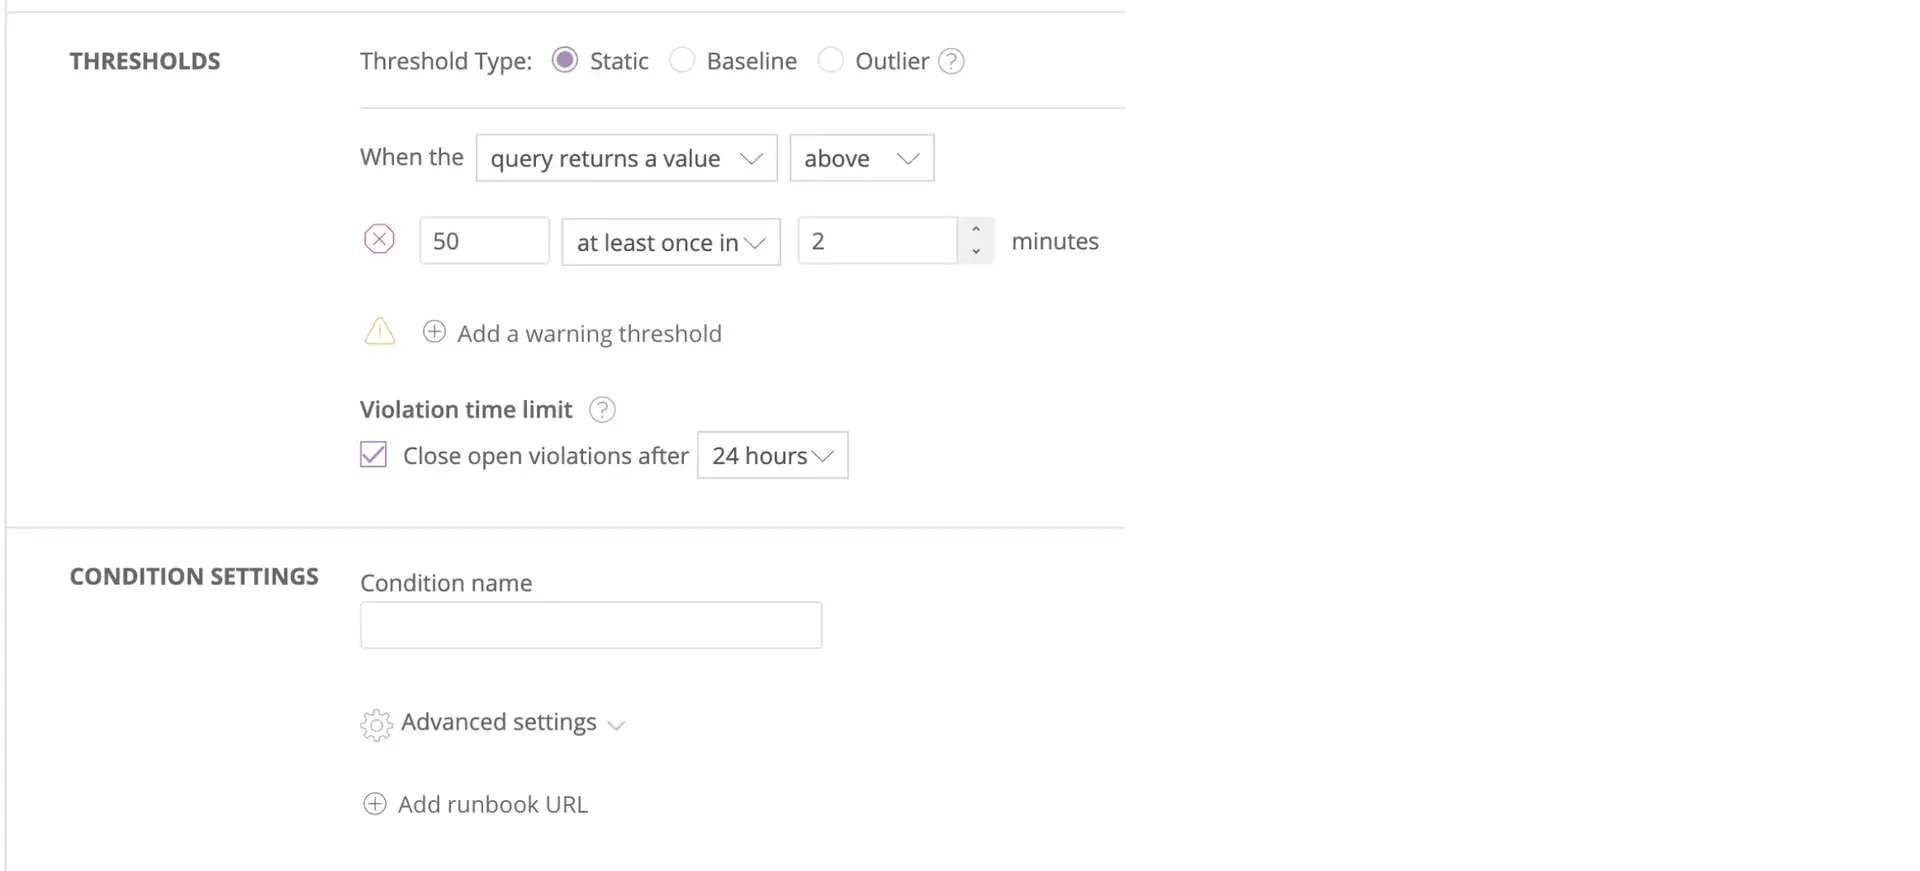 When you create the NRQL alert condition, be sure to set the **Condition name**.
If a metric with a value above 50 is sent, then an alert event is created and notified. The alert event is closed automatically after 24 hours. To test that the alert is working, run this command:
```sh
echo "prod.test.num:60|g" | nc -v -w 1 -u localhost 8125
```
````
## Find and use data [#find-use-data]
To query your data, you'd use any New Relic [query option](https://docs.newrelic.com/docs/using-new-relic/data/understand-data/query-new-relic-data). For example, you might run a [NRQL](https://docs.newrelic.com/docs/query-data/nrql-new-relic-query-language/getting-started/introduction-nrql) query like:
```sql
SELECT count(*) FROM Metric WHERE metricName = 'myMetric' AND environment = 'production'
```
For more on how to query the `Metric` data type, see [Query metric data](https://docs.newrelic.com/docs/data-ingest-apis/get-data-new-relic/metric-api/view-query-you-metric-data).
## Troubleshooting [#troubleshooting]
**Problem**:
You've followed the steps to run the StatsD integration but still need to see the expected metrics in New Relic.
**Solutions**:
Follow the steps below to troubleshoot your configuration:
- Ensure the license key contains your 40 hexadecimal character license key, and it's a valid license for the selected New Relic account ID.
- Ensure the right data center, US (default) or EU, has been selected for your New Relic account. Tip: If the license_key starts with "eu" then you must use the `NR_EU_REGION=true` flag.
- For the JP region, the endpoint is automatically selected based on your license key, so no additional flag is required.
- Ensure there are no [`NrIntegrationError`](https://docs.newrelic.com/docs/data-apis/ingest-apis/metric-api/troubleshoot-nrintegrationerror-events/) related to the StatsD integration.
- Verbose logs can be enabled using the environment variable `NR_STATSD_VERBOSE`, modify the docker run command adding the following variable: `-e NR_STATSD_VERBOSE=true`.
- A test metric can be pushed to confirm the integration is sending metrics that are expected. Example using the NetCat `nc` utility:
- `echo "example.gauge:123|g" | nc -u -w0 127.0.0.1 8125` (update `127.0.0.1` with running container IP/address).
## Check the source code [#source-code]
This integration is open source software. That means you can [browse its source code](https://github.com/newrelic/nri-statsd/) and send improvements, or create your own fork and build it.
When you create the NRQL alert condition, be sure to set the **Condition name**.
If a metric with a value above 50 is sent, then an alert event is created and notified. The alert event is closed automatically after 24 hours. To test that the alert is working, run this command:
```sh
echo "prod.test.num:60|g" | nc -v -w 1 -u localhost 8125
```
````
## Find and use data [#find-use-data]
To query your data, you'd use any New Relic [query option](https://docs.newrelic.com/docs/using-new-relic/data/understand-data/query-new-relic-data). For example, you might run a [NRQL](https://docs.newrelic.com/docs/query-data/nrql-new-relic-query-language/getting-started/introduction-nrql) query like:
```sql
SELECT count(*) FROM Metric WHERE metricName = 'myMetric' AND environment = 'production'
```
For more on how to query the `Metric` data type, see [Query metric data](https://docs.newrelic.com/docs/data-ingest-apis/get-data-new-relic/metric-api/view-query-you-metric-data).
## Troubleshooting [#troubleshooting]
**Problem**:
You've followed the steps to run the StatsD integration but still need to see the expected metrics in New Relic.
**Solutions**:
Follow the steps below to troubleshoot your configuration:
- Ensure the license key contains your 40 hexadecimal character license key, and it's a valid license for the selected New Relic account ID.
- Ensure the right data center, US (default) or EU, has been selected for your New Relic account. Tip: If the license_key starts with "eu" then you must use the `NR_EU_REGION=true` flag.
- For the JP region, the endpoint is automatically selected based on your license key, so no additional flag is required.
- Ensure there are no [`NrIntegrationError`](https://docs.newrelic.com/docs/data-apis/ingest-apis/metric-api/troubleshoot-nrintegrationerror-events/) related to the StatsD integration.
- Verbose logs can be enabled using the environment variable `NR_STATSD_VERBOSE`, modify the docker run command adding the following variable: `-e NR_STATSD_VERBOSE=true`.
- A test metric can be pushed to confirm the integration is sending metrics that are expected. Example using the NetCat `nc` utility:
- `echo "example.gauge:123|g" | nc -u -w0 127.0.0.1 8125` (update `127.0.0.1` with running container IP/address).
## Check the source code [#source-code]
This integration is open source software. That means you can [browse its source code](https://github.com/newrelic/nri-statsd/) and send improvements, or create your own fork and build it.