---
title: Use logs UI
source: https://docs.newrelic.com/docs/logs/ui-data/use-logs-ui
---
Use our logs UI to:
- Spot interesting or significant patterns in your logs.
- Examine more context around a particular log line.
- Explore and manipulate your logging data with filters and parsing rules.
- Query your data to create custom visualizations, or add those to dashboards
- Organize your organization's log data, and optimize query performance with data partitions.
- Set up alert conditions for problems you want to prevent.
- [Schedule automated NRQL searches](#workflow-search) to receive regular query results via email.
To stay up to date with new capabilities and improvements, subscribe to our [RSS feed for Logs release notes](https://docs.newrelic.com/docs/release-notes/logs-release-notes).
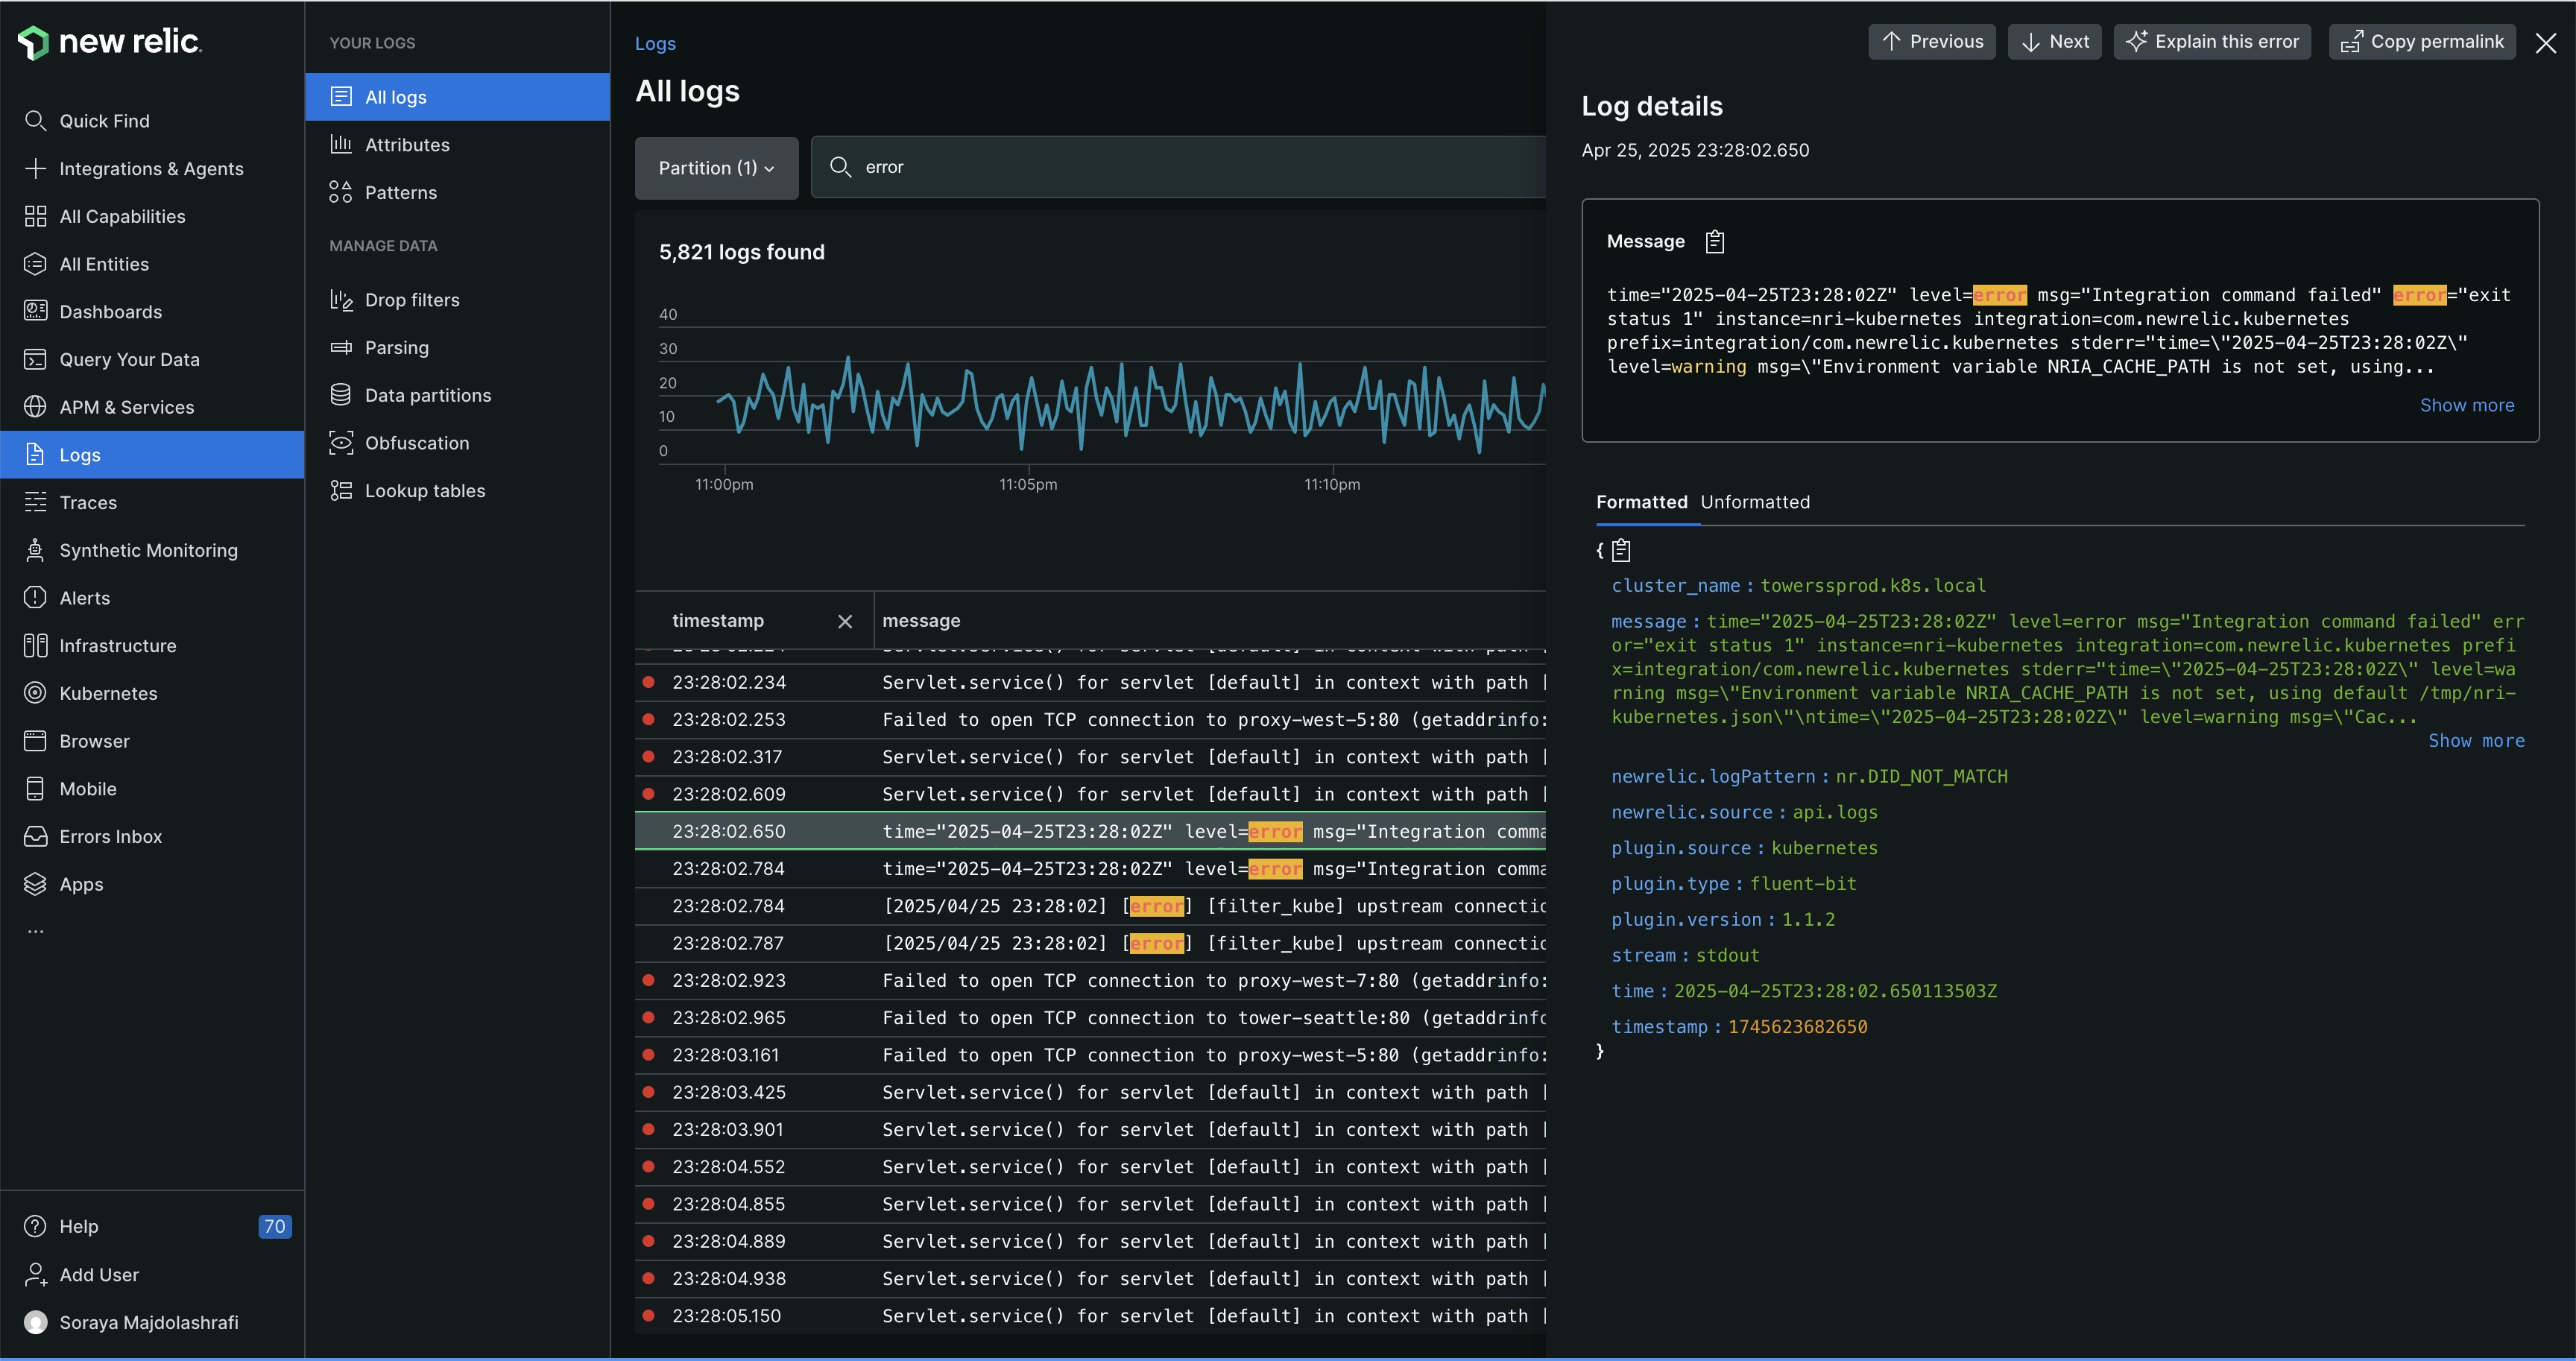
**[one.newrelic.com > All capabilities](https://one.newrelic.com/all-capabilities) > Logs**: To explore and manage your logs, use the left nav. To view detailed information, click any log line.
## Find the logs UI [#find-ui]
To find the logs UI, from **[one.newrelic.com](https://one.newrelic.com/all-capabilities)**, select **Logs**.
## Explore your log data [#ui-workflow]
Use the left nav in the logs UI as an easy workflow through all logs, attributes, patterns, live-tail logging, and queries. Manage your log data by dropping or parsing data, creating data partitions, and setting up alerts. Hash or mask any sensitive data in your logs with [obfuscation expressions and rules](https://docs.newrelic.com/docs/logs/ui-data/obfuscation-ui). Get more details about specific logs and their attributes from the center nav.
To explore your logging data, follow this basic workflow.
**1. Go to the logs UI.**
Go to our logs UI at **[one.newrelic.com > All capabilities](https://one.newrelic.com/all-capabilities) > Logs**.
If you use our [EU region data center](https://docs.newrelic.com/docs/using-new-relic/welcome-new-relic/get-started/our-eu-us-region-data-centers/), go to **[one.eu.newrelic.com](https://one.eu.newrelic.com) > Logs**. If you use the JP region data center, go to **[one.jp.newrelic.com](https://one.jp.newrelic.com) > Logs**.
If you have not [customized your New Relic navigation bar](https://docs.newrelic.com/docs/new-relic-one/use-new-relic-one/ui-data/basic-ui-features/#custom-navigation), go to **[one.newrelic.com](https://one.newrelic.com/all-capabilities)**, click **Browse data**, and select **Logs**.
**2. Look for patterns.**
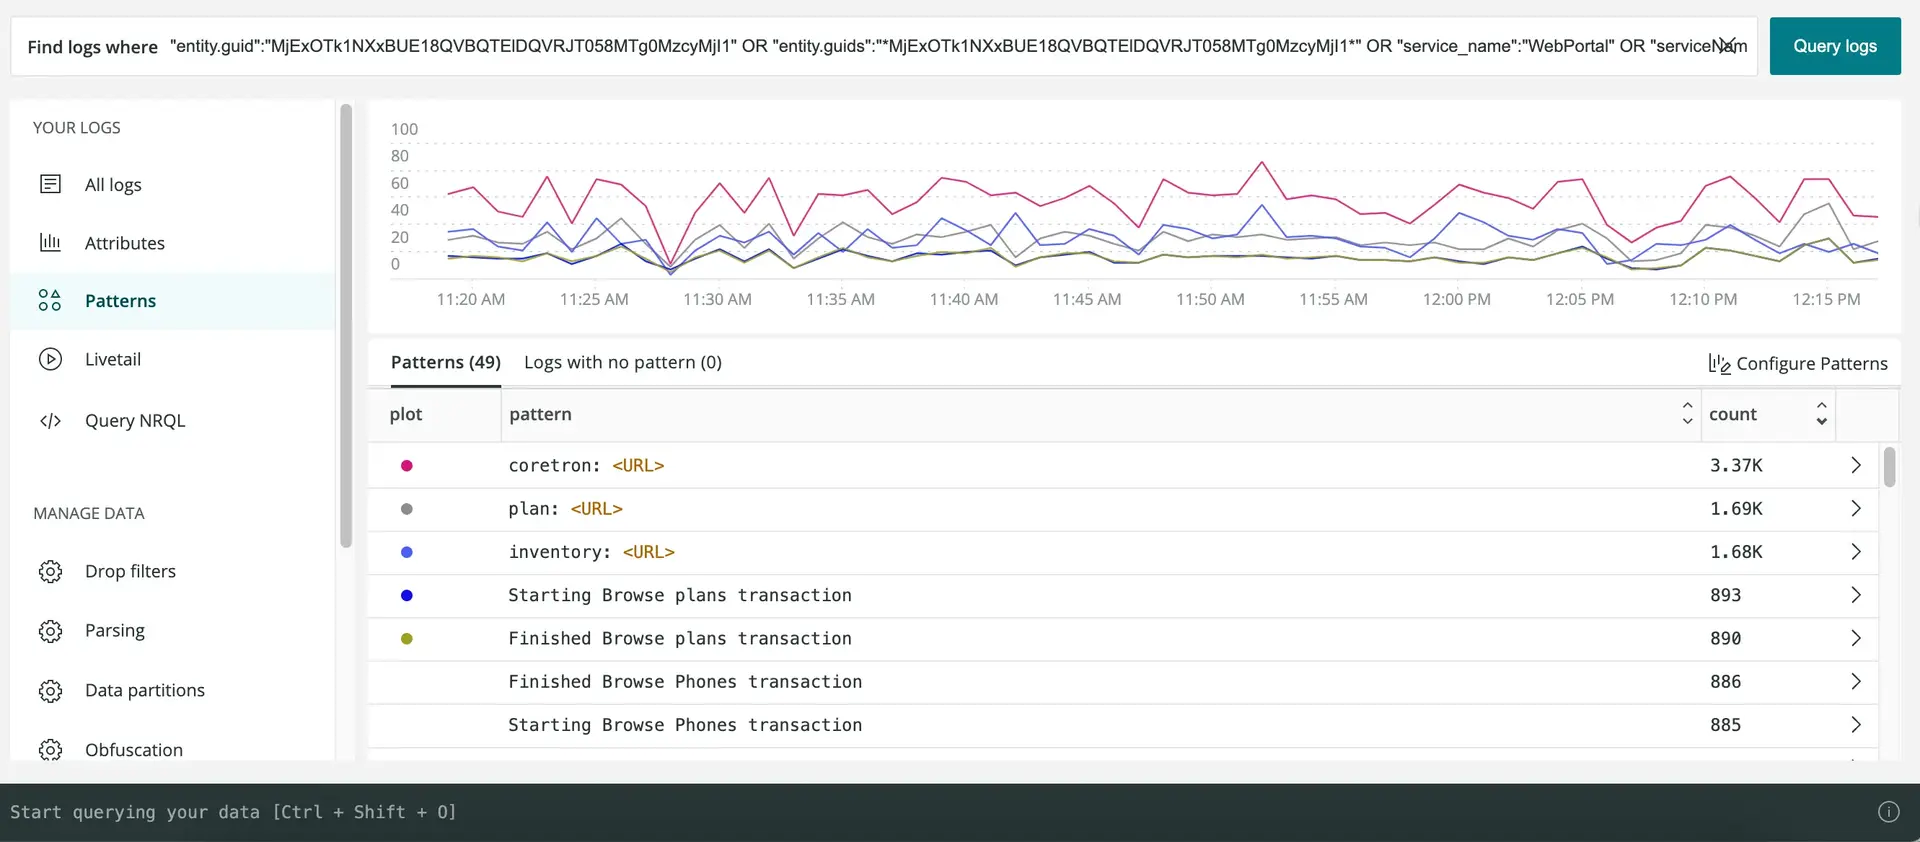
- To spot suspicious spikes or drops in log messages, click **[Patterns](https://docs.newrelic.com/docs/logs/ui-data/find-unusual-logs-log-patterns/)** on the left nav.
- To look at logs for a specific time period, click that point (or click and drag an area) on the chart, or use the time picker.
**3. Narrow your focus.**
The left nav includes options to help you narrow the focus of your initial search results or to quickly find outliers.
- If you're not sure where to start, click **Attributes** on the left nav, then select additional values as needed. For example, if a host listed under the `hostname` attribute is generating significantly more error messages than the others, select that value to apply it to your search.
- To make your log messages easier to query and understand, use our [built-in parsing rules](https://docs.newrelic.com/docs/logs/ui-data/built-log-parsing-rules/), or [create your own parsing rules](https://docs.newrelic.com/docs/logs/ui-data/parsing/) for attributes that match a particular value.
- To manage the amount of log data collected and to store fewer logs, create [drop filter rules](https://docs.newrelic.com/docs/logs/ui-data/drop-data-drop-filter-rules/) that avoid collecting data you don't need.
**4. Examine log details.**
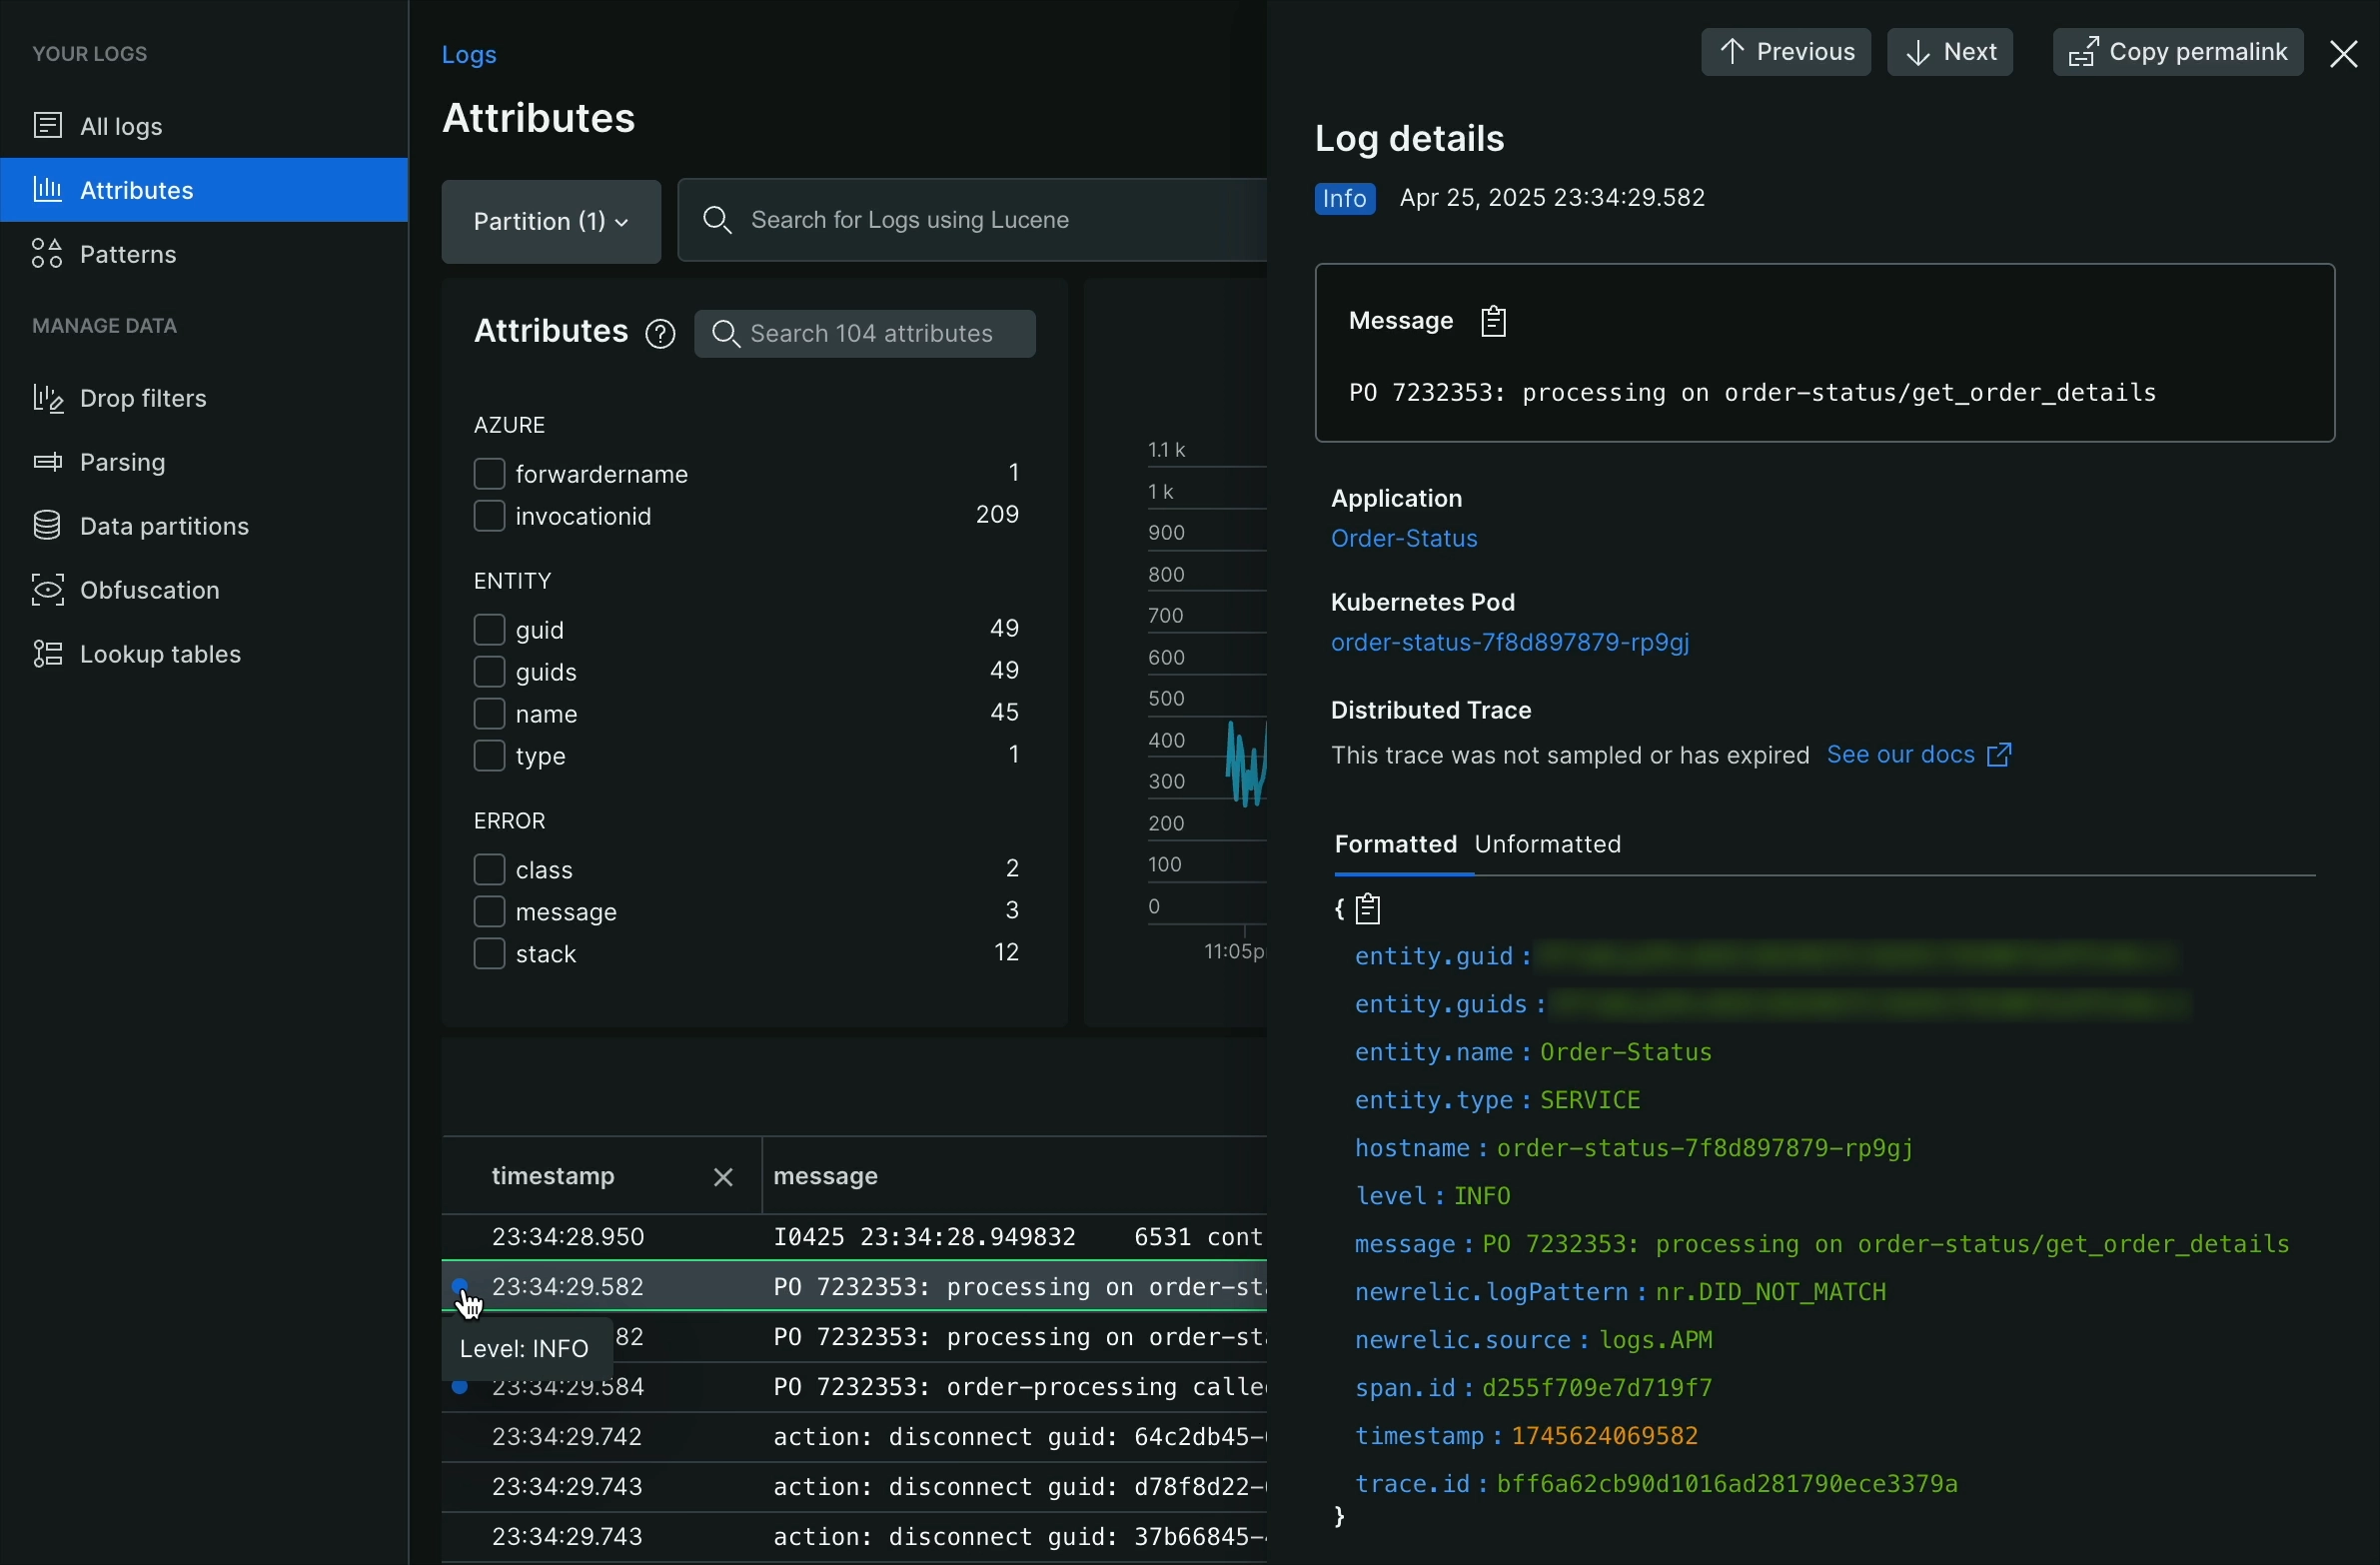
If applicable, log messages indicate a severity level (`INFO`, `DEBUG`, etc.). Select a log message to view its details as a table of attributes or as JSON.
- To see which attributes are included in a log message, click the log line.
- To help troubleshoot problems related to a specific value in the log details, [show surrounding logs](https://docs.newrelic.com/docs/logs/troubleshooting/find-issues-cause-or-impact-surrounding-logs) for the attribute's details.
- To get more details in extremely long messages, expand the data stored as [blobs](https://docs.newrelic.com/docs/logs/ui-data/long-logs-blobs/).
**5. Query and search.**
By default, the logs UI shows all your logs, but you can also search with keywords or phrases to find the results you want. For example:
````
process failed
```
You can also use the search field with type-ahead dropdowns to select an attribute, operator, and value. For example:
```
service_name equals my service
```
To help your query focus on the details you need, add or remove attributes by doing either of the following:
* On the left nav, select **Attributes**, select the values you want, then click **Query logs**.
* On the logs table, click the **+** icon to add an attribute, then click on it to add it to the query.
To switch from the Lucene-syntax search bar to a NRQL query, click the **NRQL** button beside the search bar. There is no direct equivalence between NRQL and Lucene, and this means that the NRQL query will often be simpler and not as complex, but this gives you a helpful start for building a query with the same data.
For more information on querying your logs, see the [logs query syntax docs](/docs/logs/ui-data/query-syntax-logs/).
**Schedule a search**
We're still working on this feature, but we'd love for you to try it out!
This feature is currently provided as part of a preview program pursuant to our [pre-release policies](/docs/licenses/license-information/referenced-policies/new-relic-pre-release-policy).
After composing and running a query in the logs UI, you can schedule it to run automatically and receive results via email:
1. From the **All logs** page, compose and run your query.
2. To schedule the search, use either of these options:
* At the top-right corner, click and select **Schedule search**.
* Below the query trend chart, click the clock icon.
3. Configure your [scheduled NRQL search](/docs/nrql/using-nrql/schedule-nrql-searches) with notification settings, schedule, and output format.
To view and manage all your scheduled searches, go to **[one.newrelic.com](https://one.newrelic.com) > Administration > Scheduled searches**. Learn more about [managing scheduled searches](/docs/nrql/using-nrql/schedule-nrql-searches/#manage).
````
**6. Advanced log analysis with NRDB query builder.**
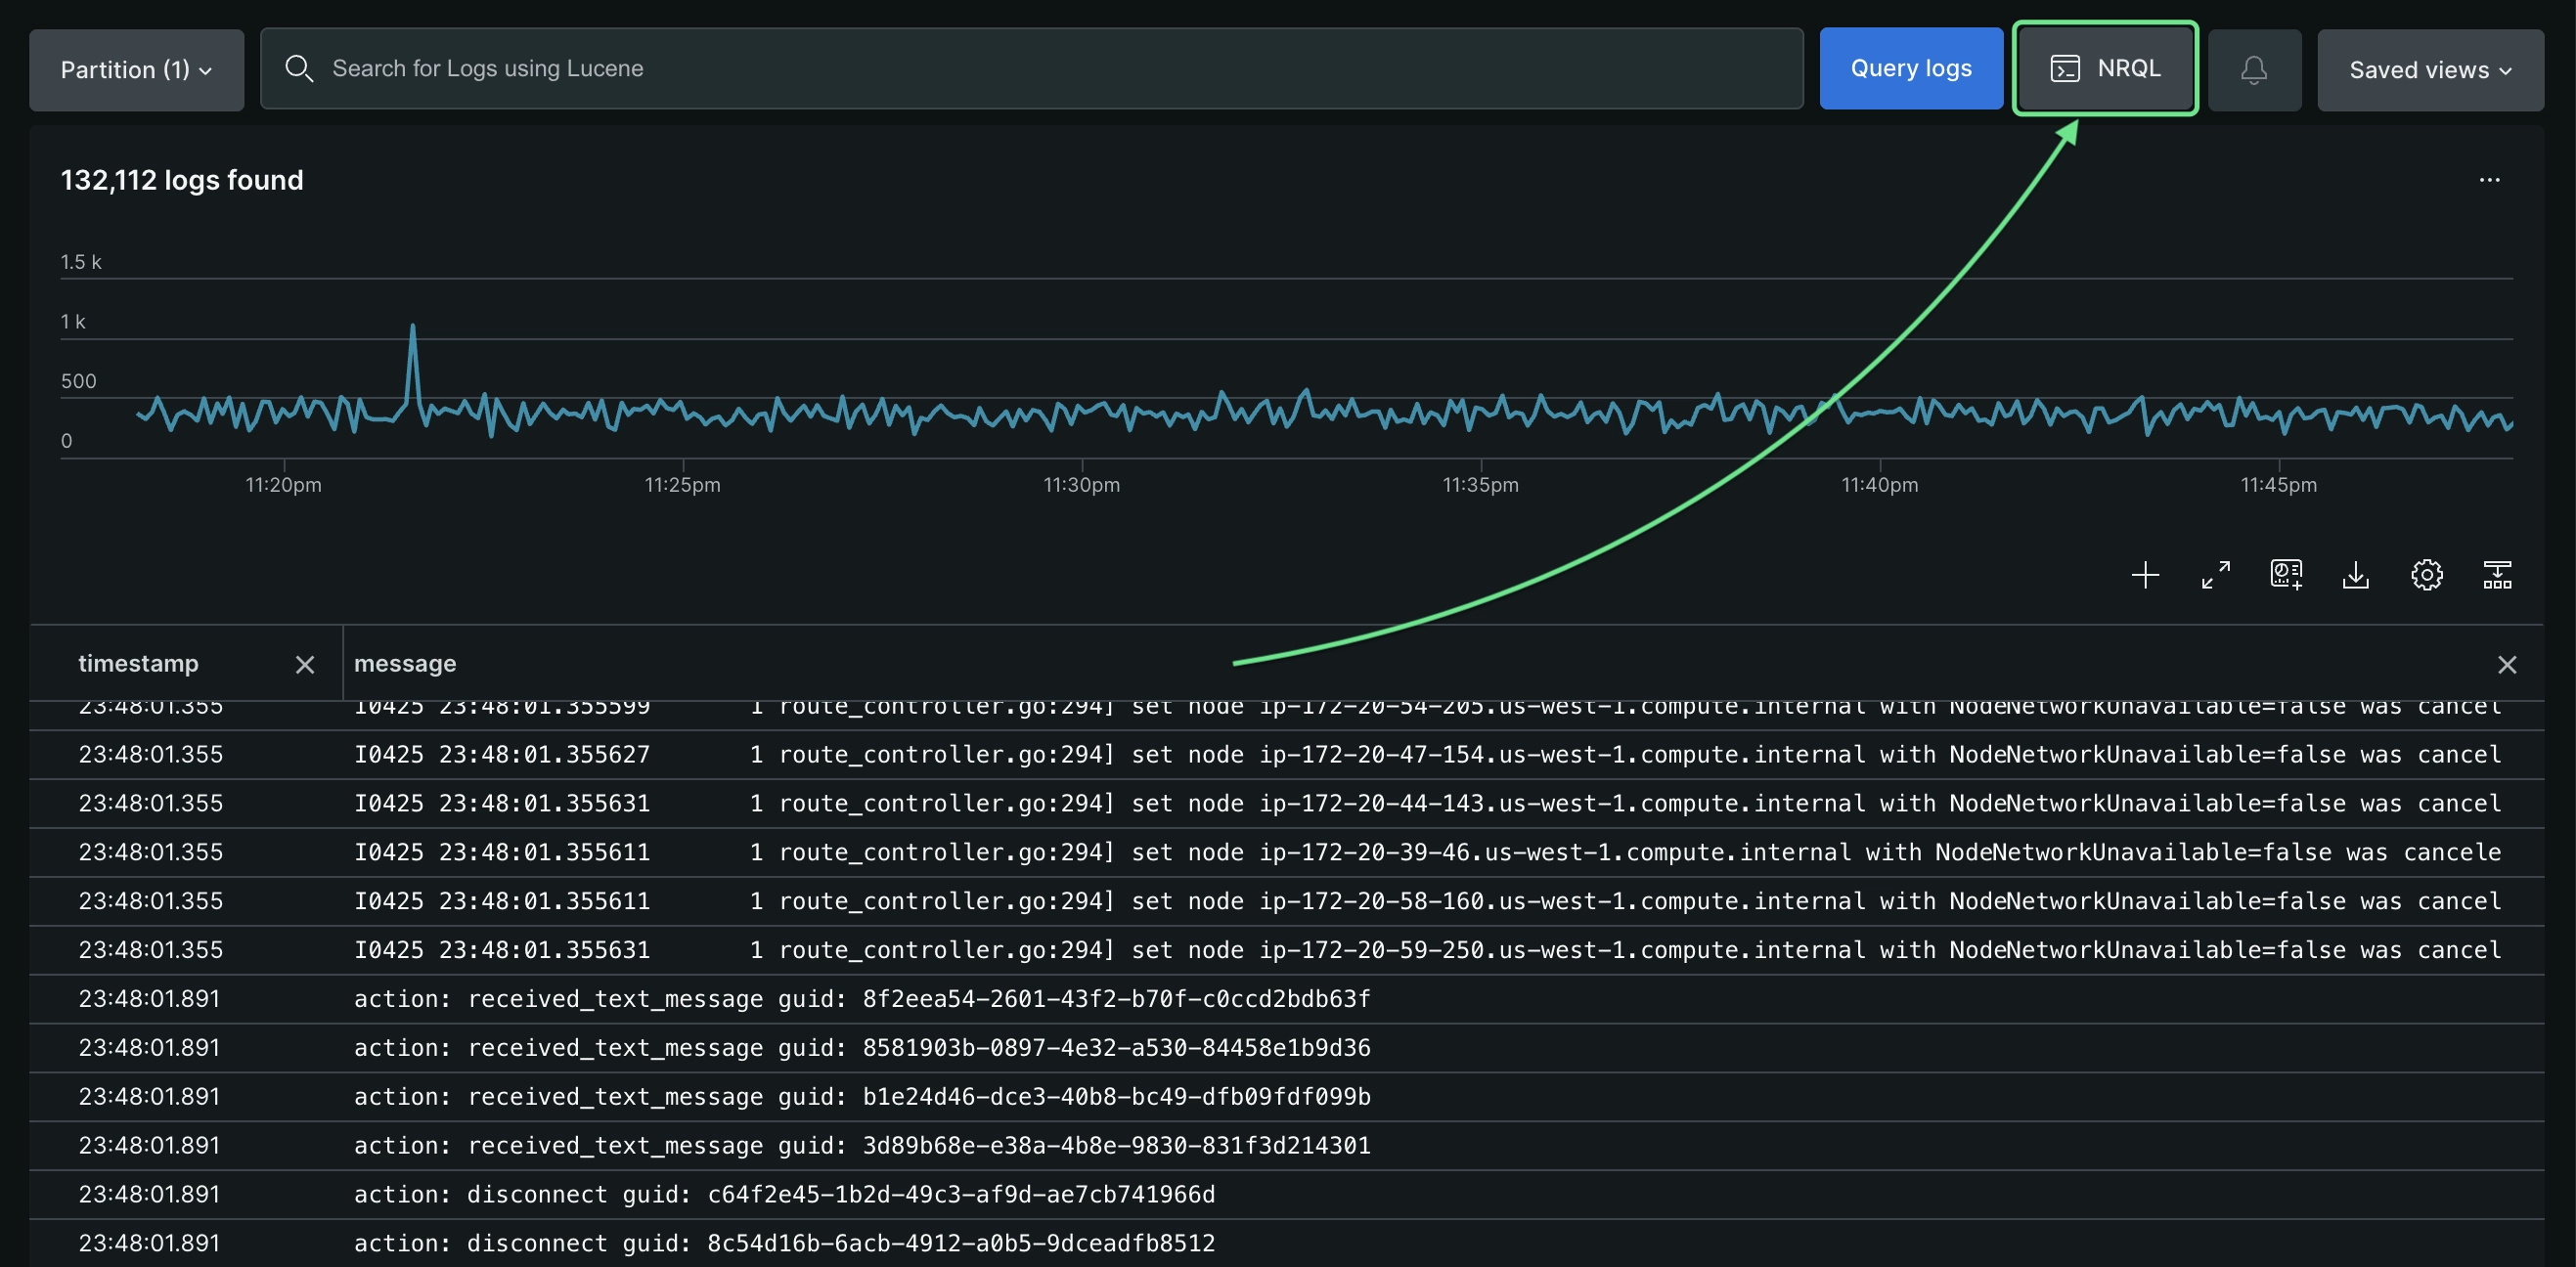
You can write NRQL queries on log events without losing your filters with the [NRDB query builder](https://docs.newrelic.com/docs/query-your-data/explore-query-data/query-builder/introduction-query-builder/). Click the **NRQL** button to the right of the Logs search bar, then start querying.
**7. Get related logs.**
Focusing on the most useful logs can help you with:
- **Optimizing performance:** To organize data within an account and to optimize query performance, create [data partition rules](https://docs.newrelic.com/docs/logs/ui-data/data-partitions/).
- **Controlling data access:** To restrict which users can access specific log partitions, use [data access control](https://docs.newrelic.com/docs/accounts/accounts-billing/new-relic-one-user-management/data-access-control) to create policies for user groups.
- **Reviewing deployments:** To immediately see how your system responds to deployments or other app changes, enable [live-tail logging](https://docs.newrelic.com/docs/logs/troubleshooting/view-log-messages-real-time-live-tail).
- **Bypassing unrelated details:** To view all the logs for a specific value, review the attributes list in the **Log details** for the selected log, then continue to add or remove attributes as needed.
- **Finding the root cause:** To help identify an issue's root cause before it occurred or its impact after an event, click **...** in the **Log details** to [show surrounding logs](https://docs.newrelic.com/docs/logs/troubleshooting/find-issues-cause-or-impact-surrounding-logs).
- **Getting more context:** To see logs related to other telemetry data for your apps and hosts, use [logs in context](https://docs.newrelic.com/docs/logs/logs-context/logs-in-context).
**8. Dive deep into distributed traces.**
Once you've narrowed down the set of logs with filters and then opened a specific log, you can see related distributed traces. As long as you've set up distributed tracing and there are sampled traces related to logs, you'll see an option to view them. This is a quick way to view trace information without going to the main distributed tracing page.
If you open the **Log details** pane and see a **Distributed trace** section, you have two options to view span traces in a waterfall view:
- Click directly on the trace name or click the icon with an arrow on the right, which opens up the waterfall focus view that highlights trace spans with errors.
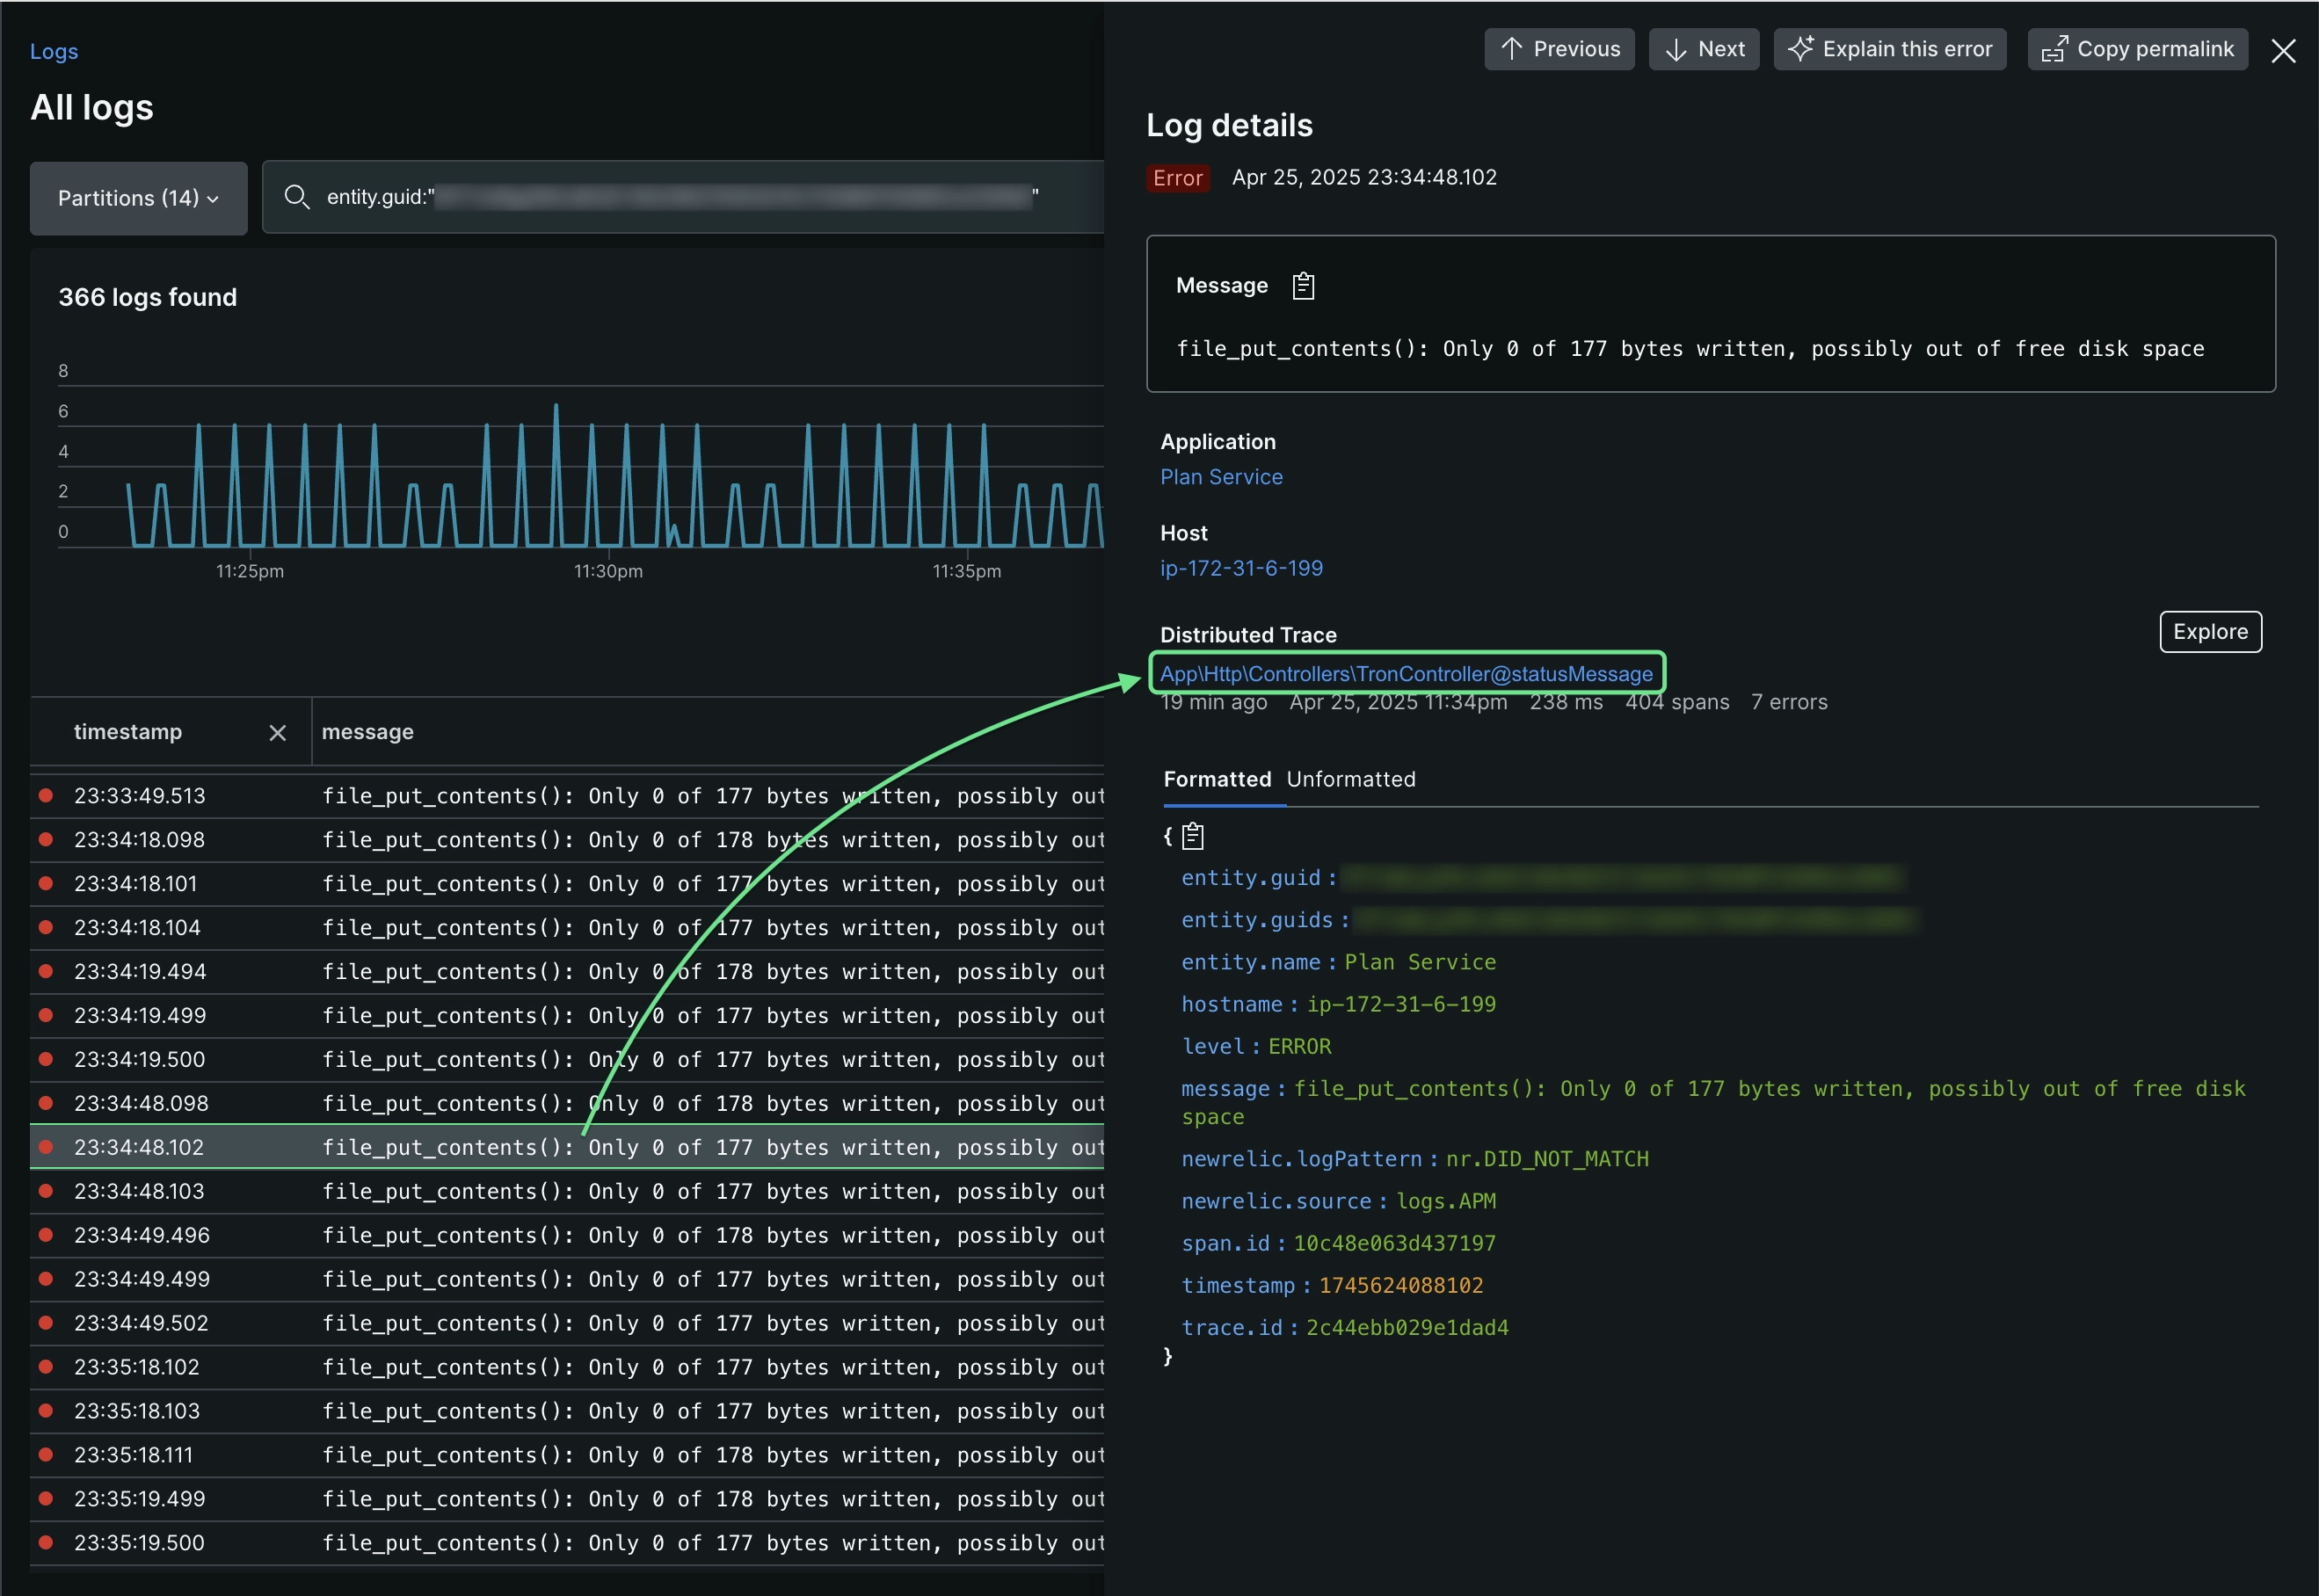
- Alternatively, you can click **Explore** to open an unfiltered waterfall where you can click through all the spans.
> #### 💡 TIP
>
> If you need help using the trace waterfall, see [Understand and use the distributed tracing UI](https://docs.newrelic.com/docs/distributed-tracing/ui-data/understand-use-distributed-tracing-ui/).
**9. Share your findings.**
Use any of the core New Relic UI functions to [explore your data](https://docs.newrelic.com/docs/query-your-data/explore-query-data/browse-data/introduction-data-explorer/) (specific account, time range, metrics and events, query builder, etc.) and share the data with charts, add to dashboards, etc. For more information, see the [examples](#examples) in this document.
## Export [#export]
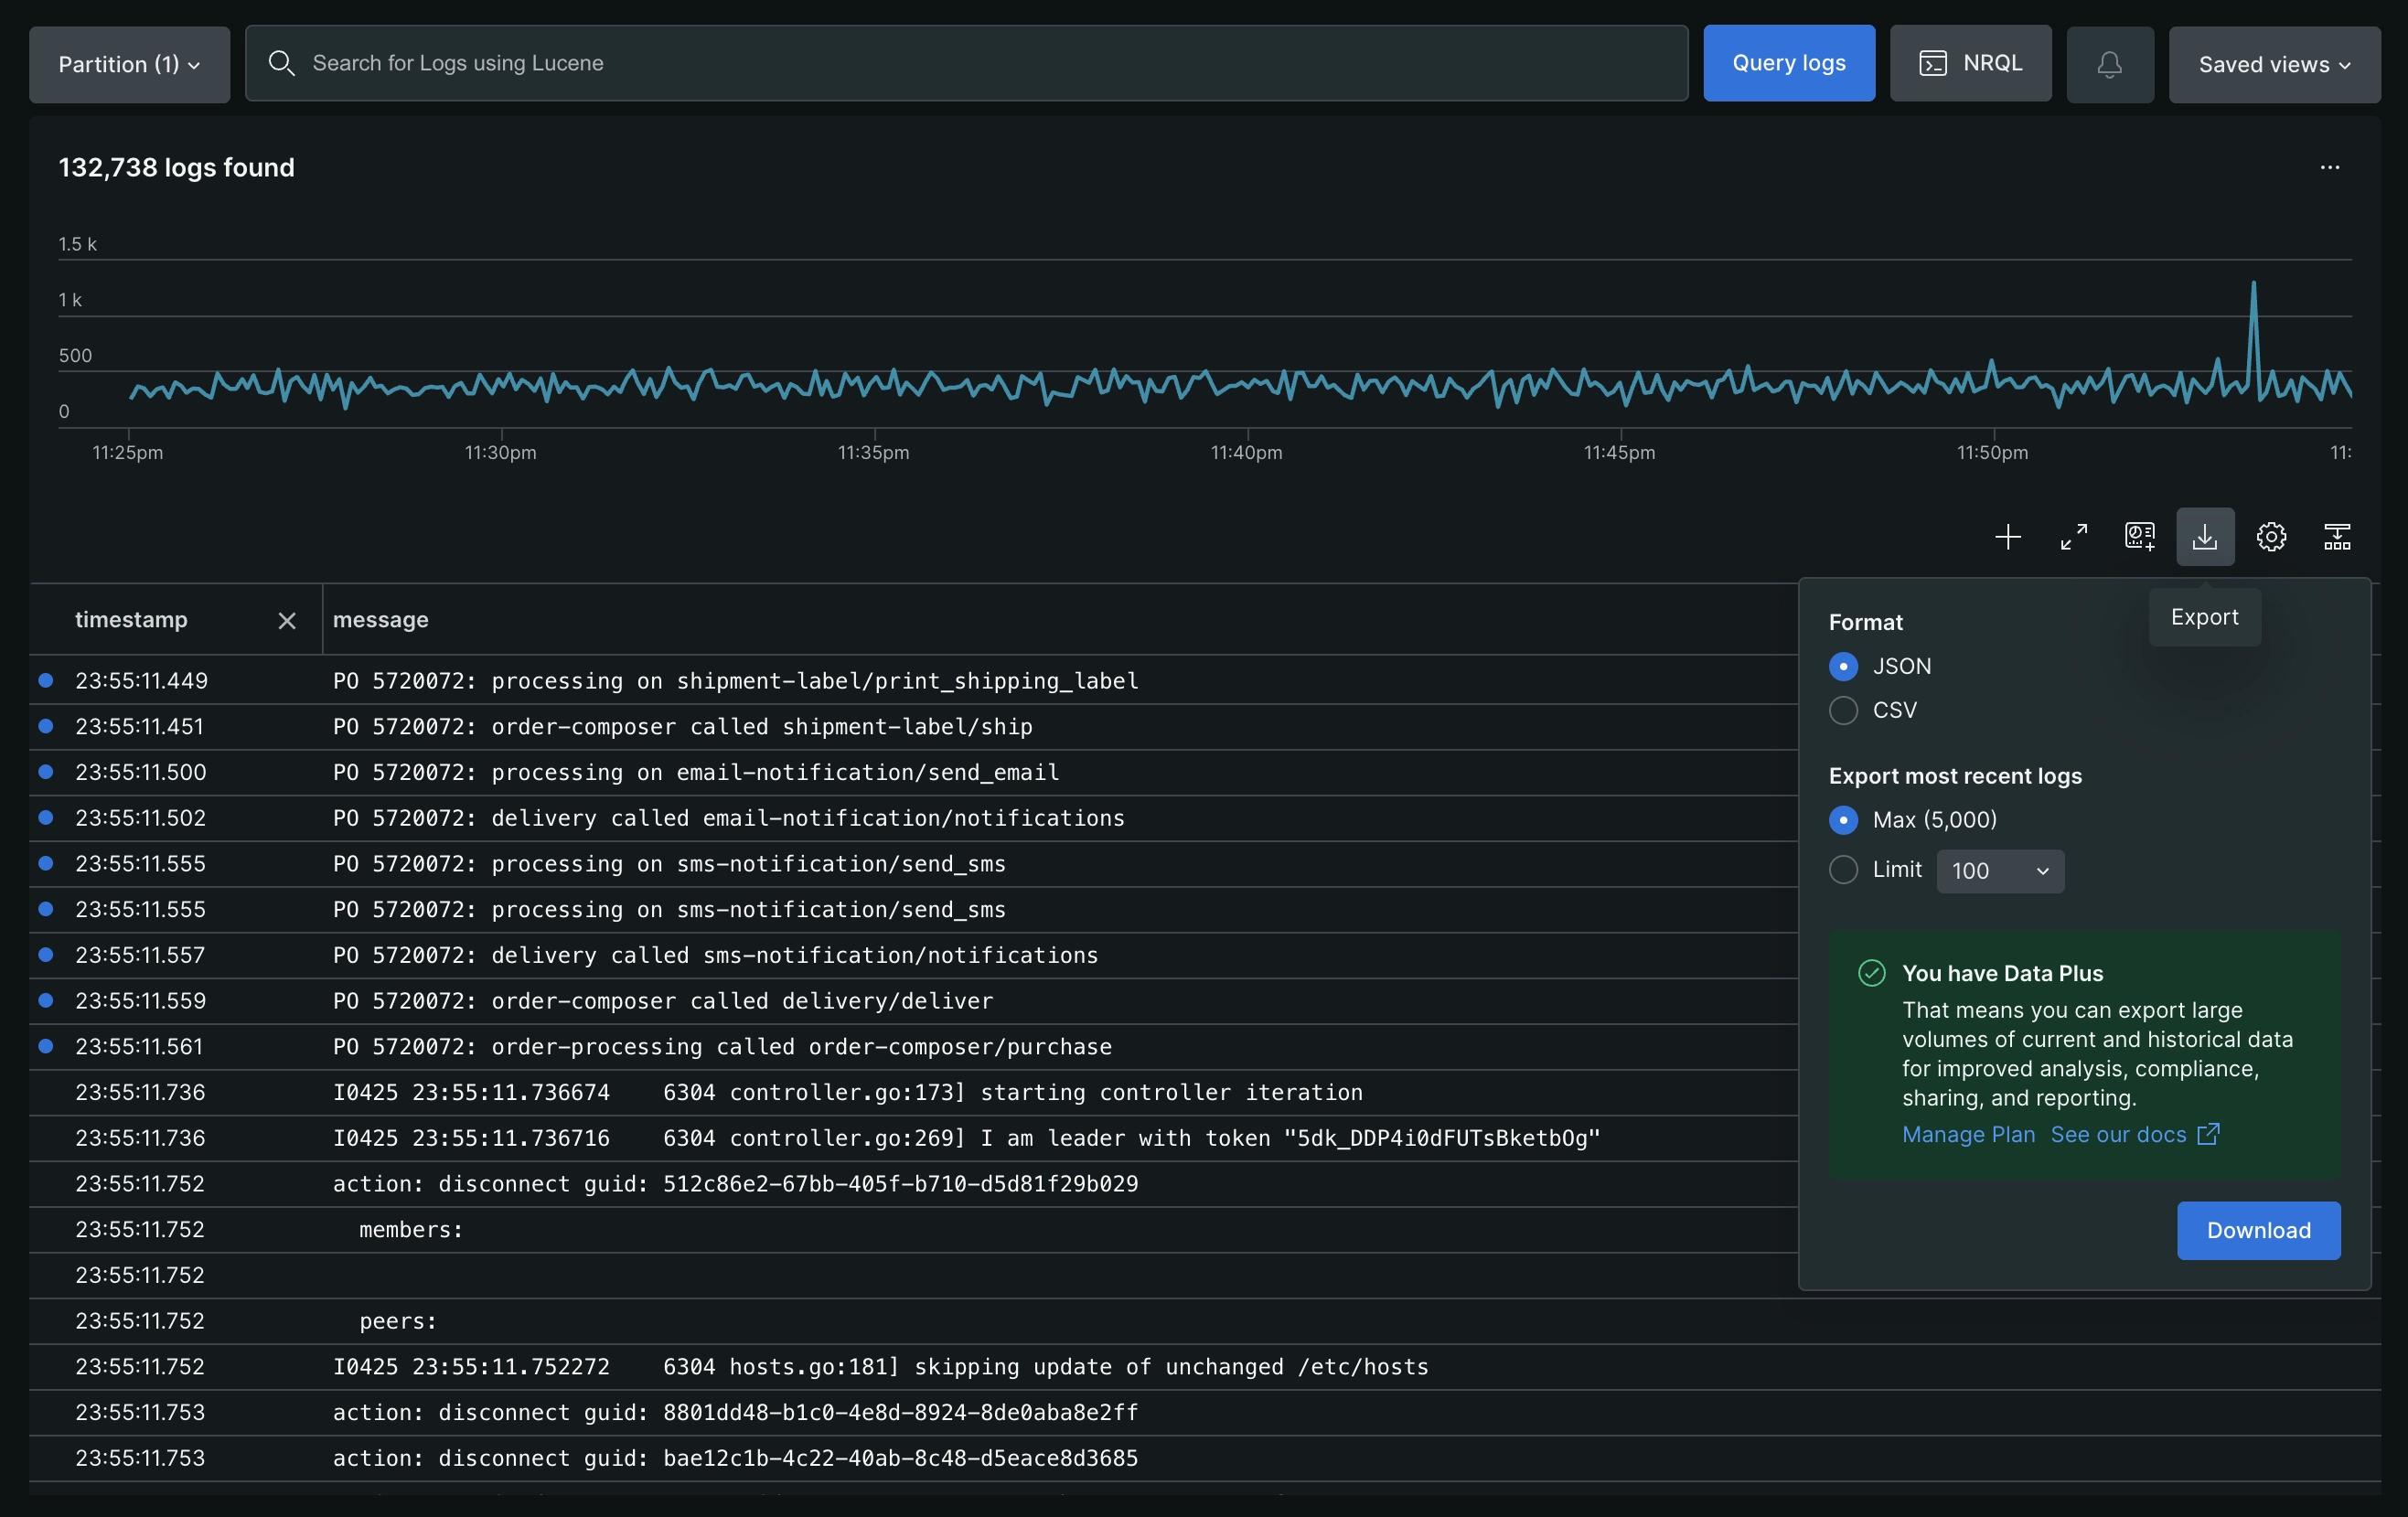
To export a subset of your logs to share, users can leverage our dedicated Export feature in the Logs UI. This feature will allow an export of up to 5000 log records in either CSV or JSON format. The log records will be downloaded locally on your machine in the `/Downloads/` folder of your current browser.
## Customizable table views [#customizable-table-views]
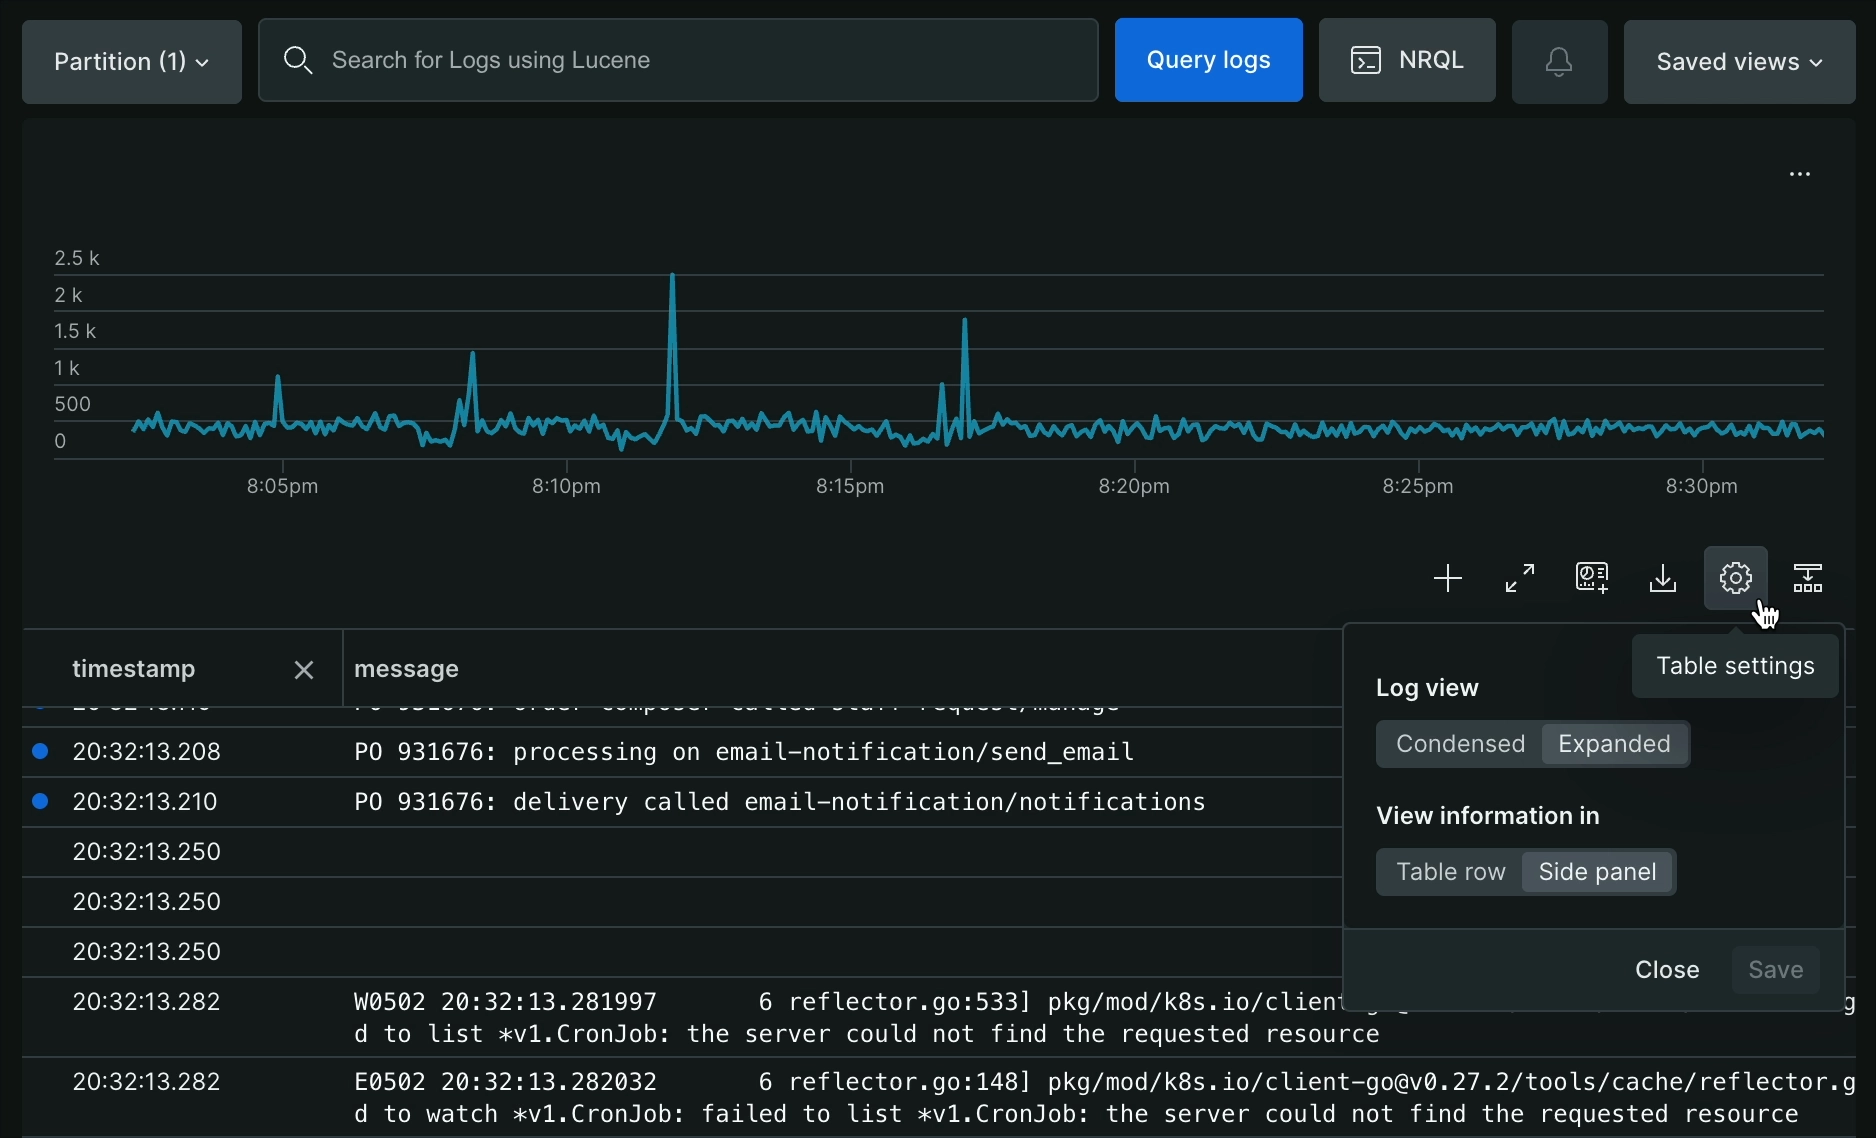
Customize how you interact with your log data using the Table settings option.
### Set the log view
Select how log entries are displayed in the table:
- **Condensed:** Display each log entry in a single line, allowing for rapid scanning of a large volume of logs.
- **Expanded:** Display the full content of each log entry by default for immediate access to all details.
### Set the log detail exploration
Select how to view the details of individual log entries:
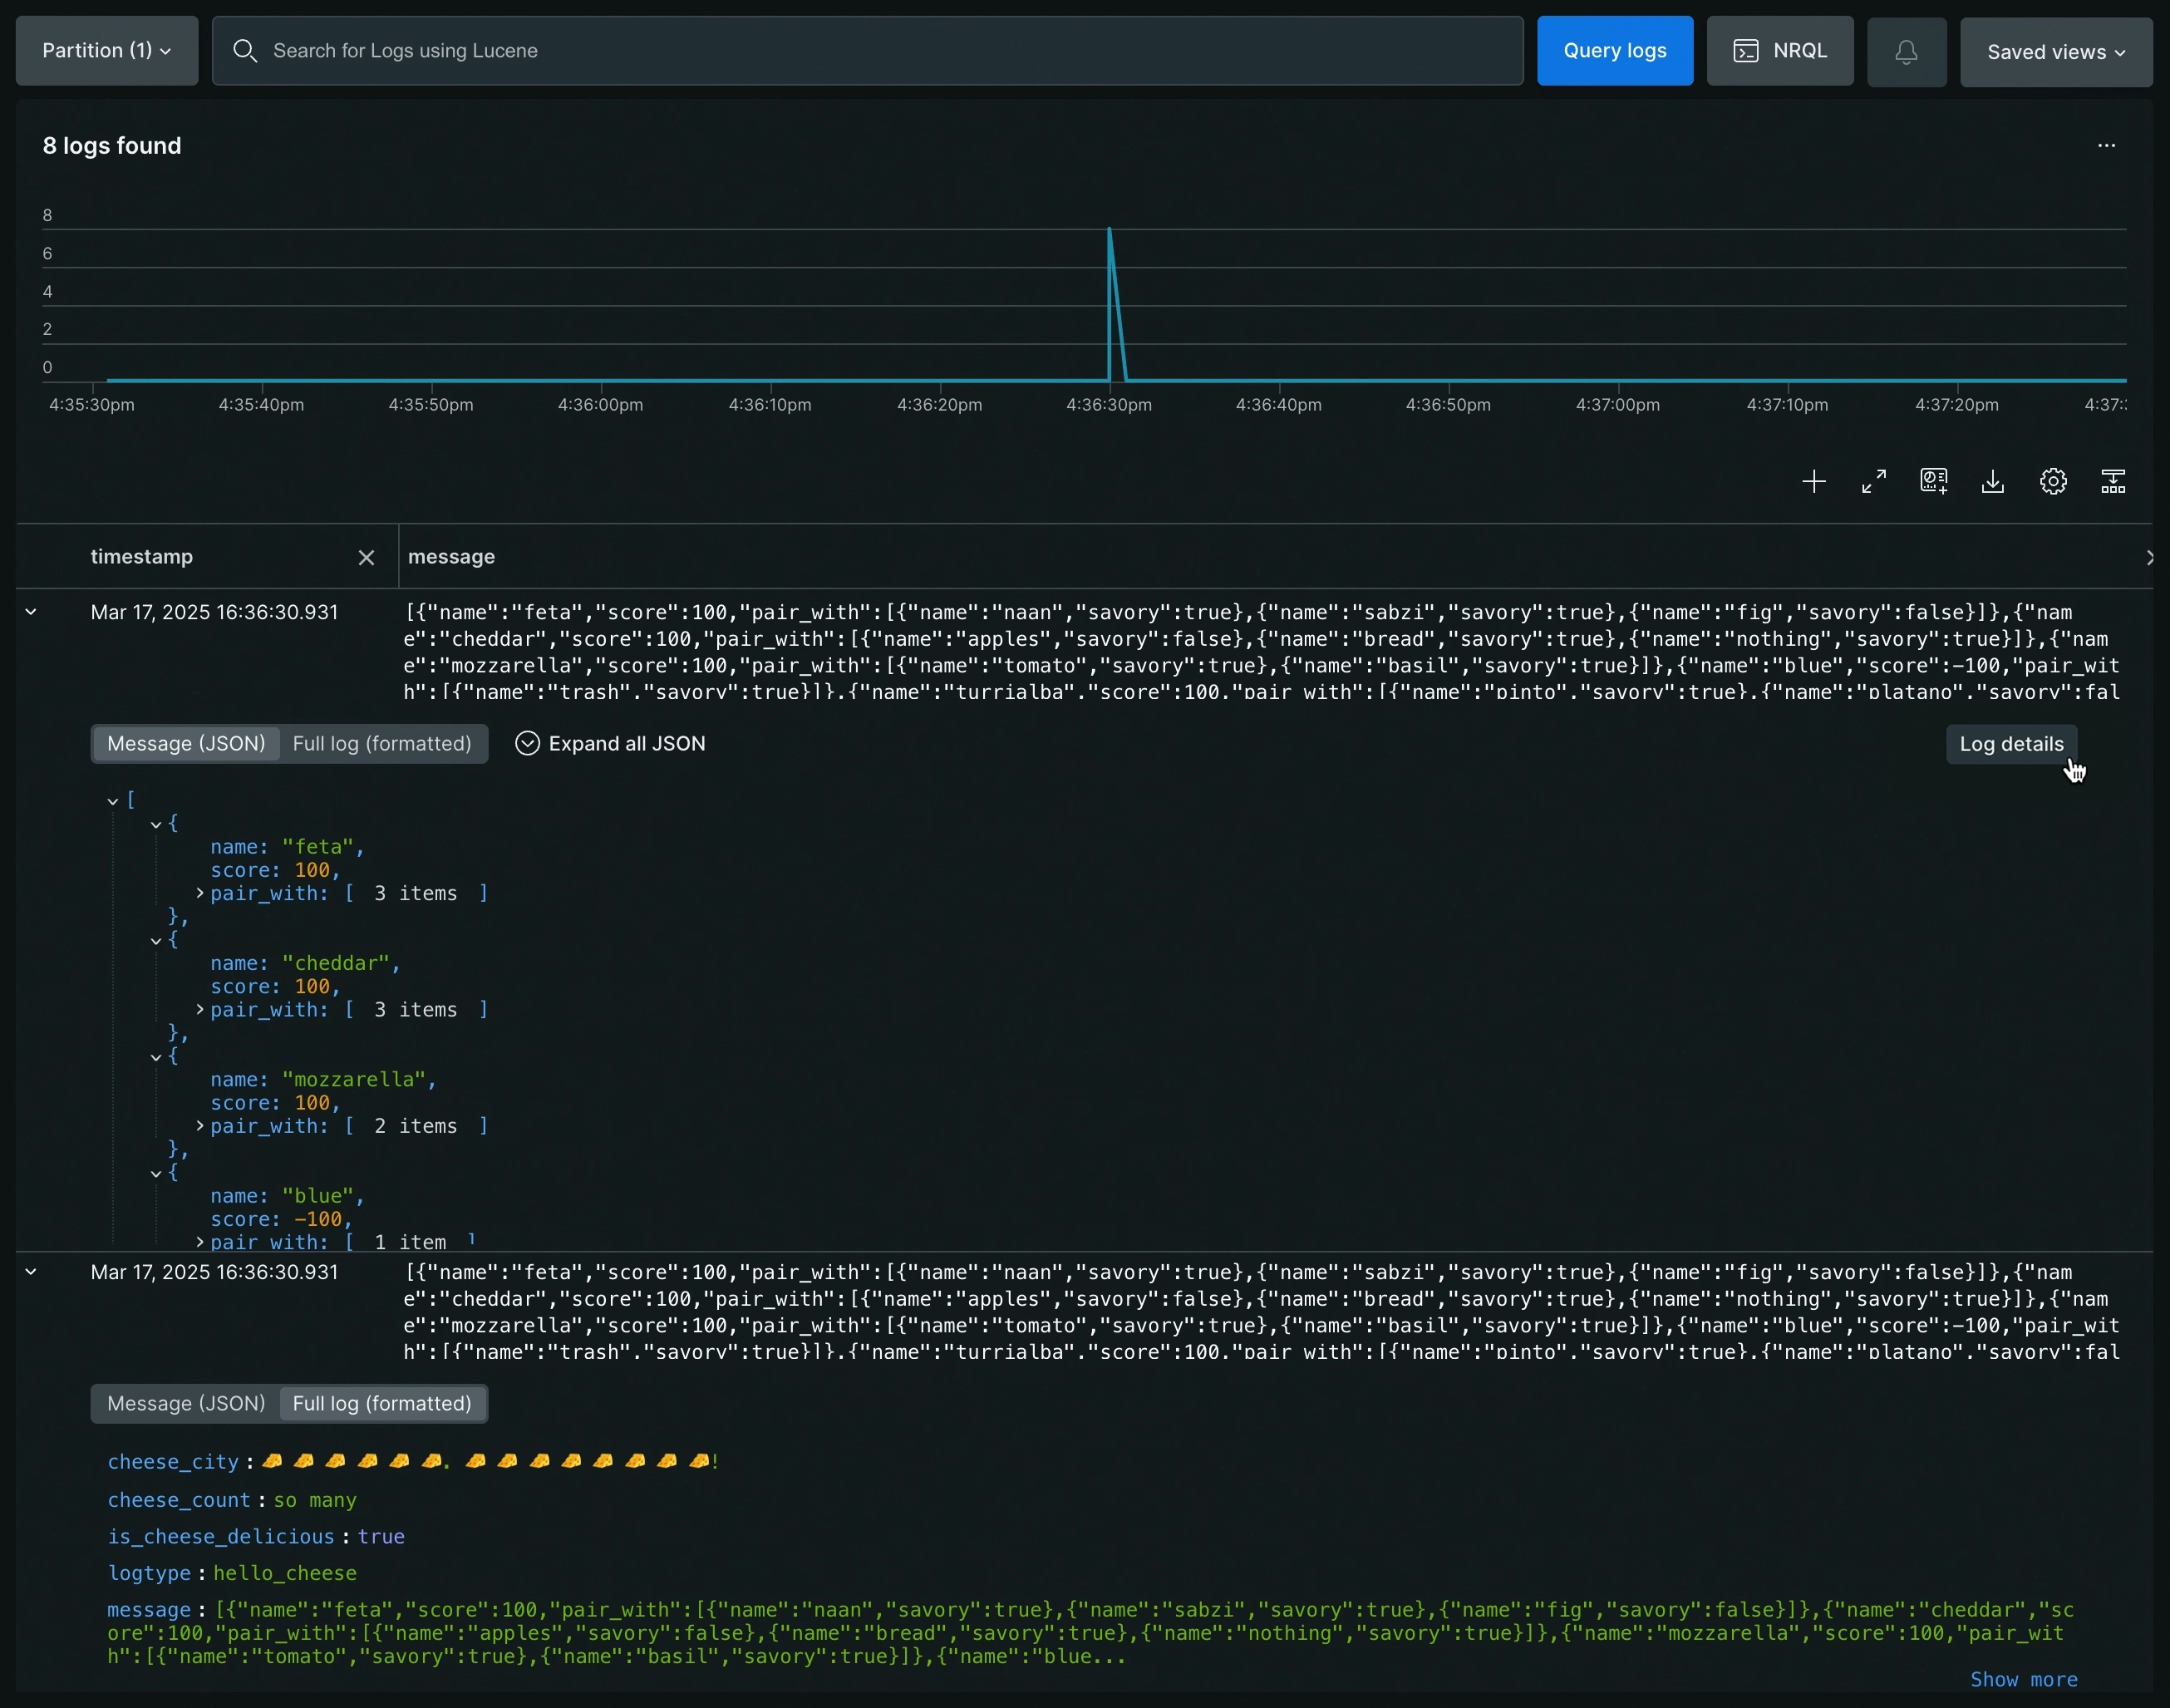
- **Side Panel:** Select a log entry to open a side panel on the right. The panel displays complete log details, including logs in context.
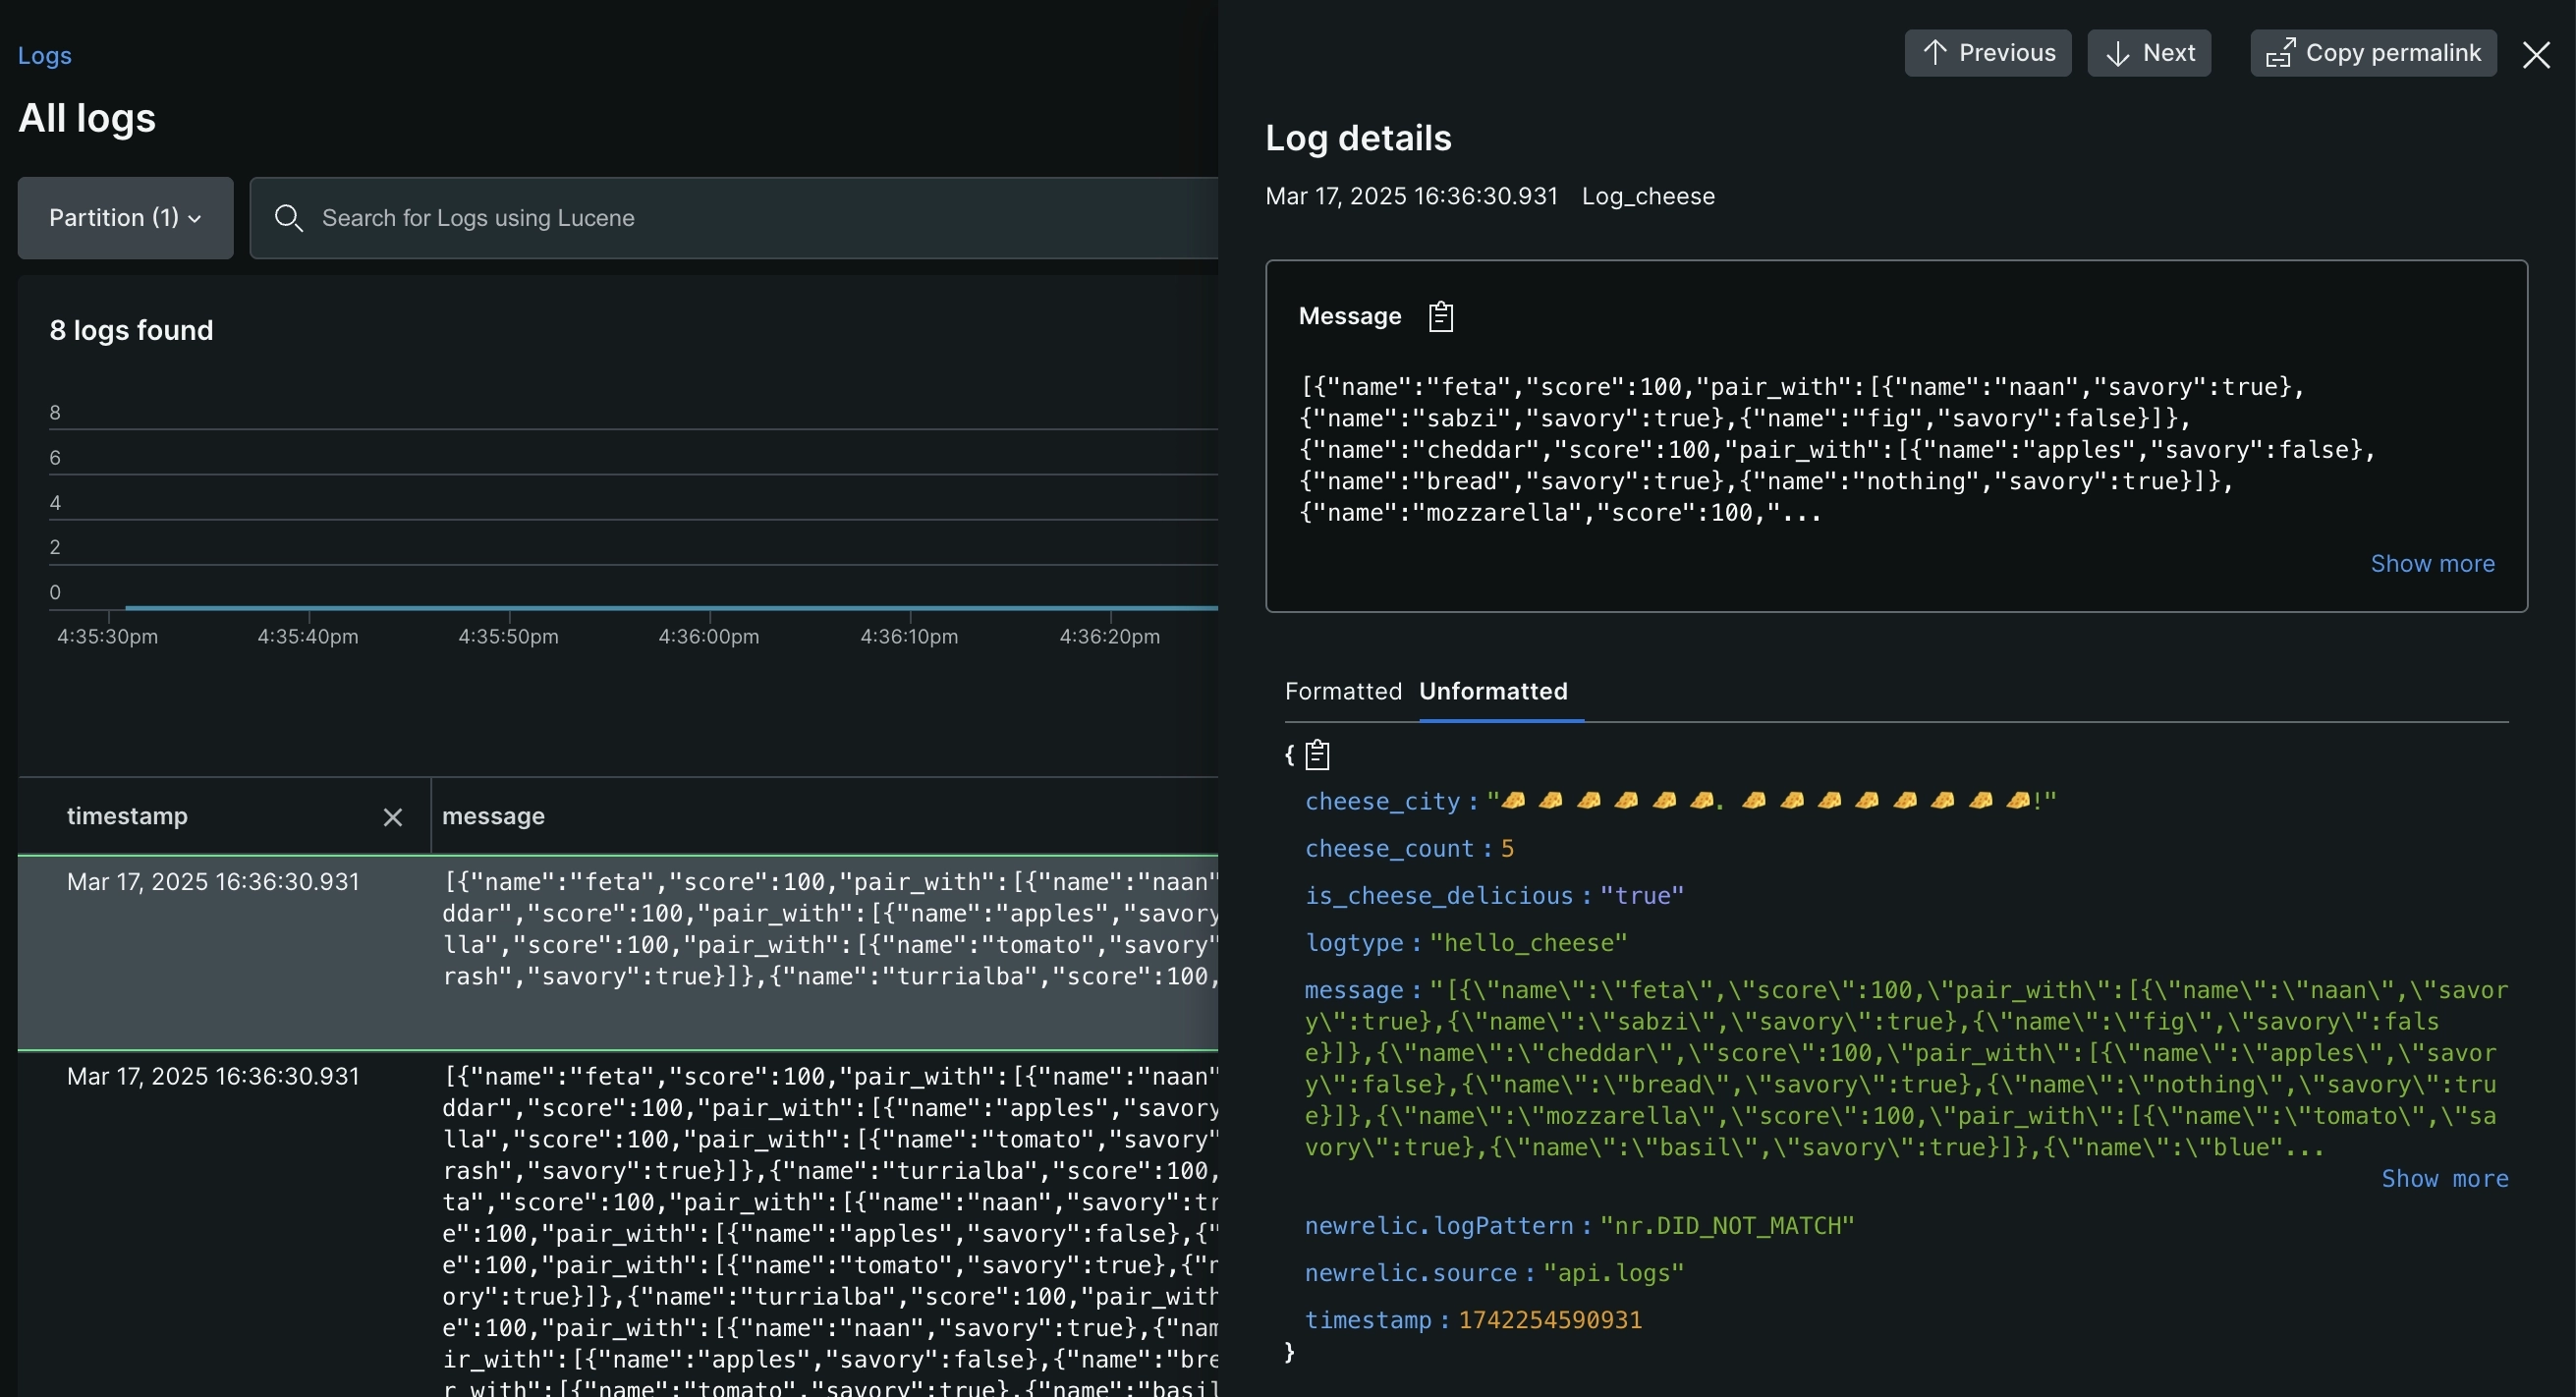
- **Table Row:** Select a log entry to expand it within the table and view the full log content. If a log message contains a JSON object, it is automatically formatted for easier analysis. Alternatively, hover over the log row and click **Show log detail** to open the side panel.
## Permissions [#permissions]
For details on permissions by user type, see [User type](https://docs.newrelic.com/docs/accounts/accounts-billing/new-relic-one-user-management/user-type/#logs-capabilities).
You can create a custom role that restricts the `NRQL drop rules` capability and limits the creation of drop filters. If needed, you can also add the restriction to basic users. [Learn more about drop rules](https://docs.newrelic.com/docs/accounts/accounts-billing/new-relic-one-user-management/user-permissions#capability-definitions).
## Save your views [#saved-views]
You can save your logs query, table configuration, time range, and attribute grouping in a saved view, so that you can quickly return to it later. To save a log analytics view after you've configured the view:
1. From any of the UI pages in the **Your logs** section, click **Saved views** on the right, then click **Create new**.
2. Give the current view a name.
3. Select which aspects from the current view you want to save.
4. Select permissions for your team members' access.
## Examples [#examples]
Here are a few examples of how you can use our logs UI to get detailed information.
**Create an alert from log data.**
You can create alert conditions directly in the logs UI:
1. Go to **[one.newrelic.com > All capabilities](https://one.newrelic.com/all-capabilities) > Logs**.
2. Search for results that you want to alert on; for example, `service_name:"your service" "fatal error"`.
3. Click the ellipses button next to the **Query in Lucene** button.
4. Select **Create alert**.
5. Complete the procedure.
6. Review the NRQL query that will power the alert condition.
After you save the alert condition, you can view it in the alerts UI, where you can make additional changes as needed.
**Add log charts to a dashboard.**
From the **Logs** UI, you can add log data as a [table widget](https://docs.newrelic.com/docs/query-your-data/explore-query-data/use-charts/chart-types/#widget-table) to a dashboard. You can also create log tables with metrics and events or the query builder in New Relic.
1. Go to **[one.newrelic.com > All capabilities](https://one.newrelic.com/all-capabilities) > Logs**.
2. On the right, click **Saved views** and select a saved view. Or, search for results you want to plot; for example, `service_name:"checkout service" "process failed"`.
3. Click **Add to dashboard**, then fill out the details to add the log chart as a table to an existing or new dashboard.
Then, from your dashboard you can:
- Use standard dashboard widget functions, such as copying, editing, deleting, and more.
- Click any log row to show details about it.
- Update your query to add more columns.
- Query log data from other available accounts, and add more charts (for example, as comparative data) to your dashboard.
- Click **Open in logs** to go directly to the **Logs** UI for additional troubleshooting.
**Troubleshoot an error (logs in context).**
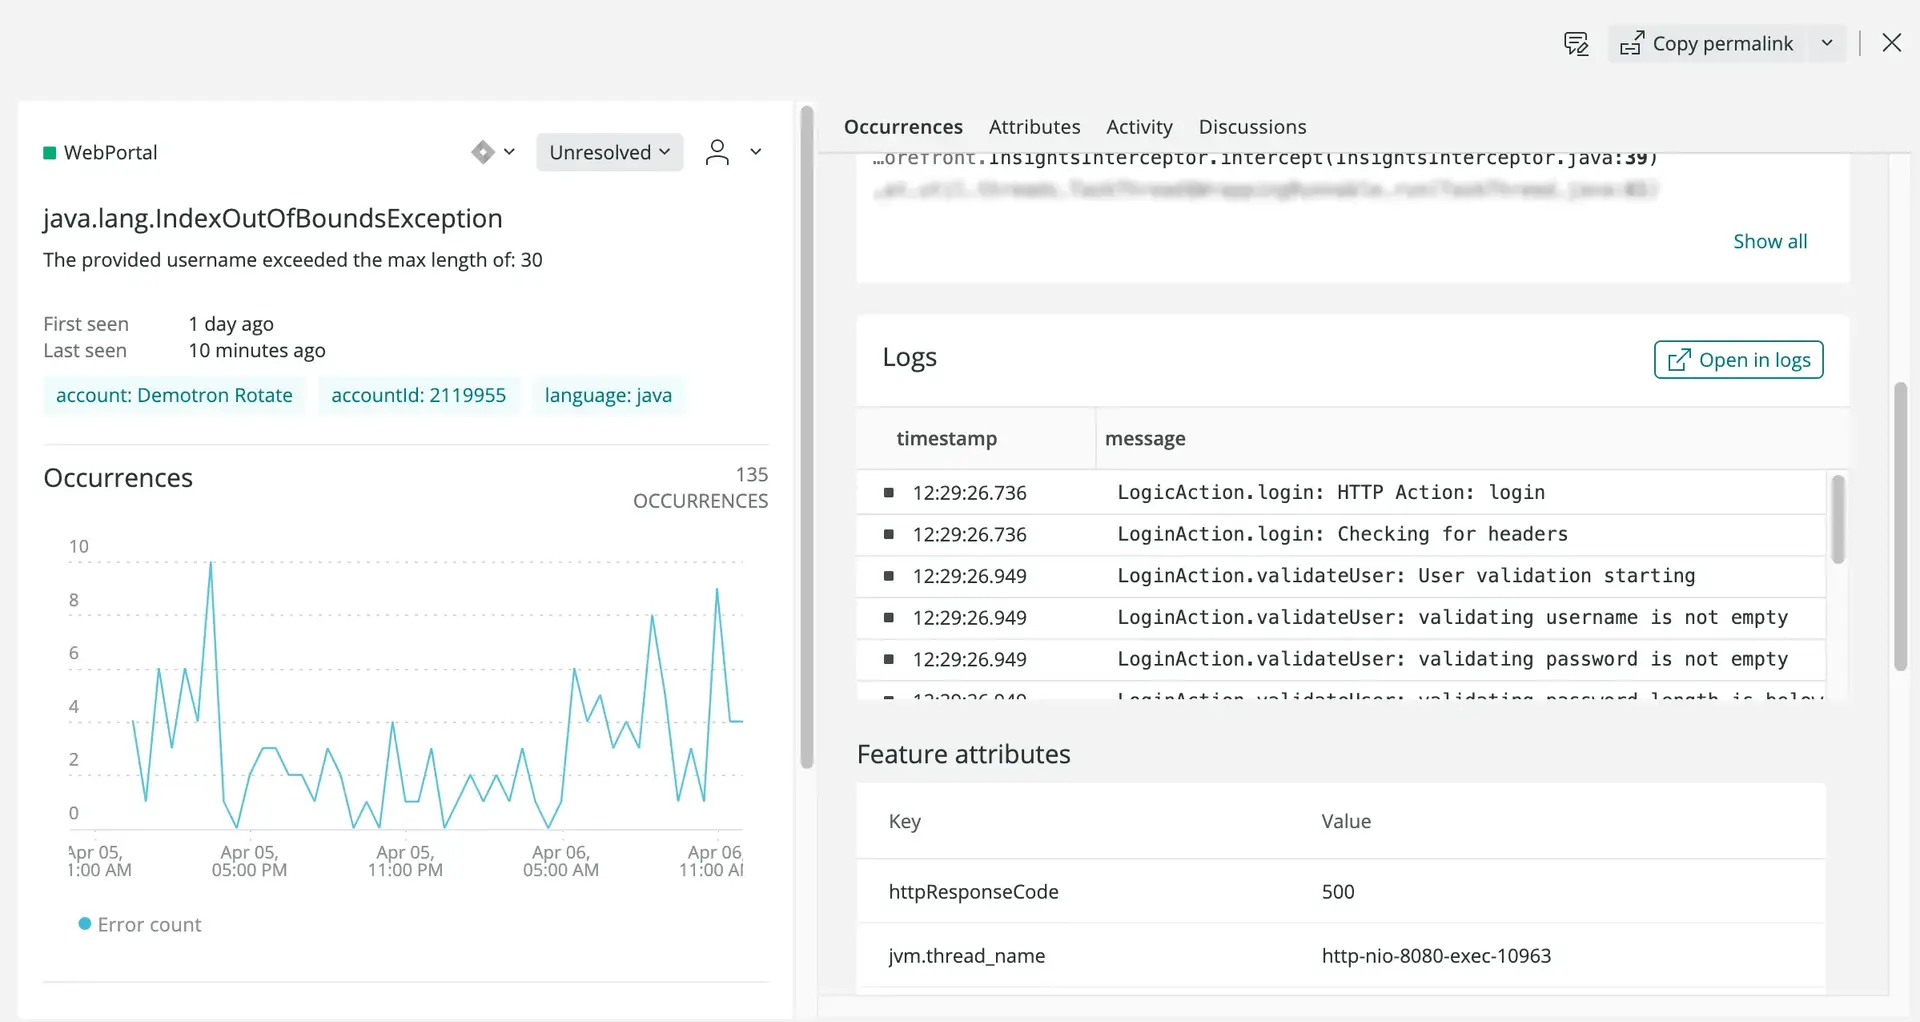
To have a better understanding of what was happening on the host at the time an error occurred in your app, you must be able to see [logs in context](https://docs.newrelic.com/docs/logs/logs-context/configure-logs-context-apm-agents/). Then, to troubleshoot related errors:
1. Go to **APM > Errors inbox** or **APM > (select an app) > Events > Error analytics**, and select an error trace.
2. From the error trace details, click **Open in logs**.
3. Browse the related log details.
4. To identify the host generating the error, click **...** for your choice, then click **Show surrounding logs**.
**Troubleshoot latency (logs in context)**
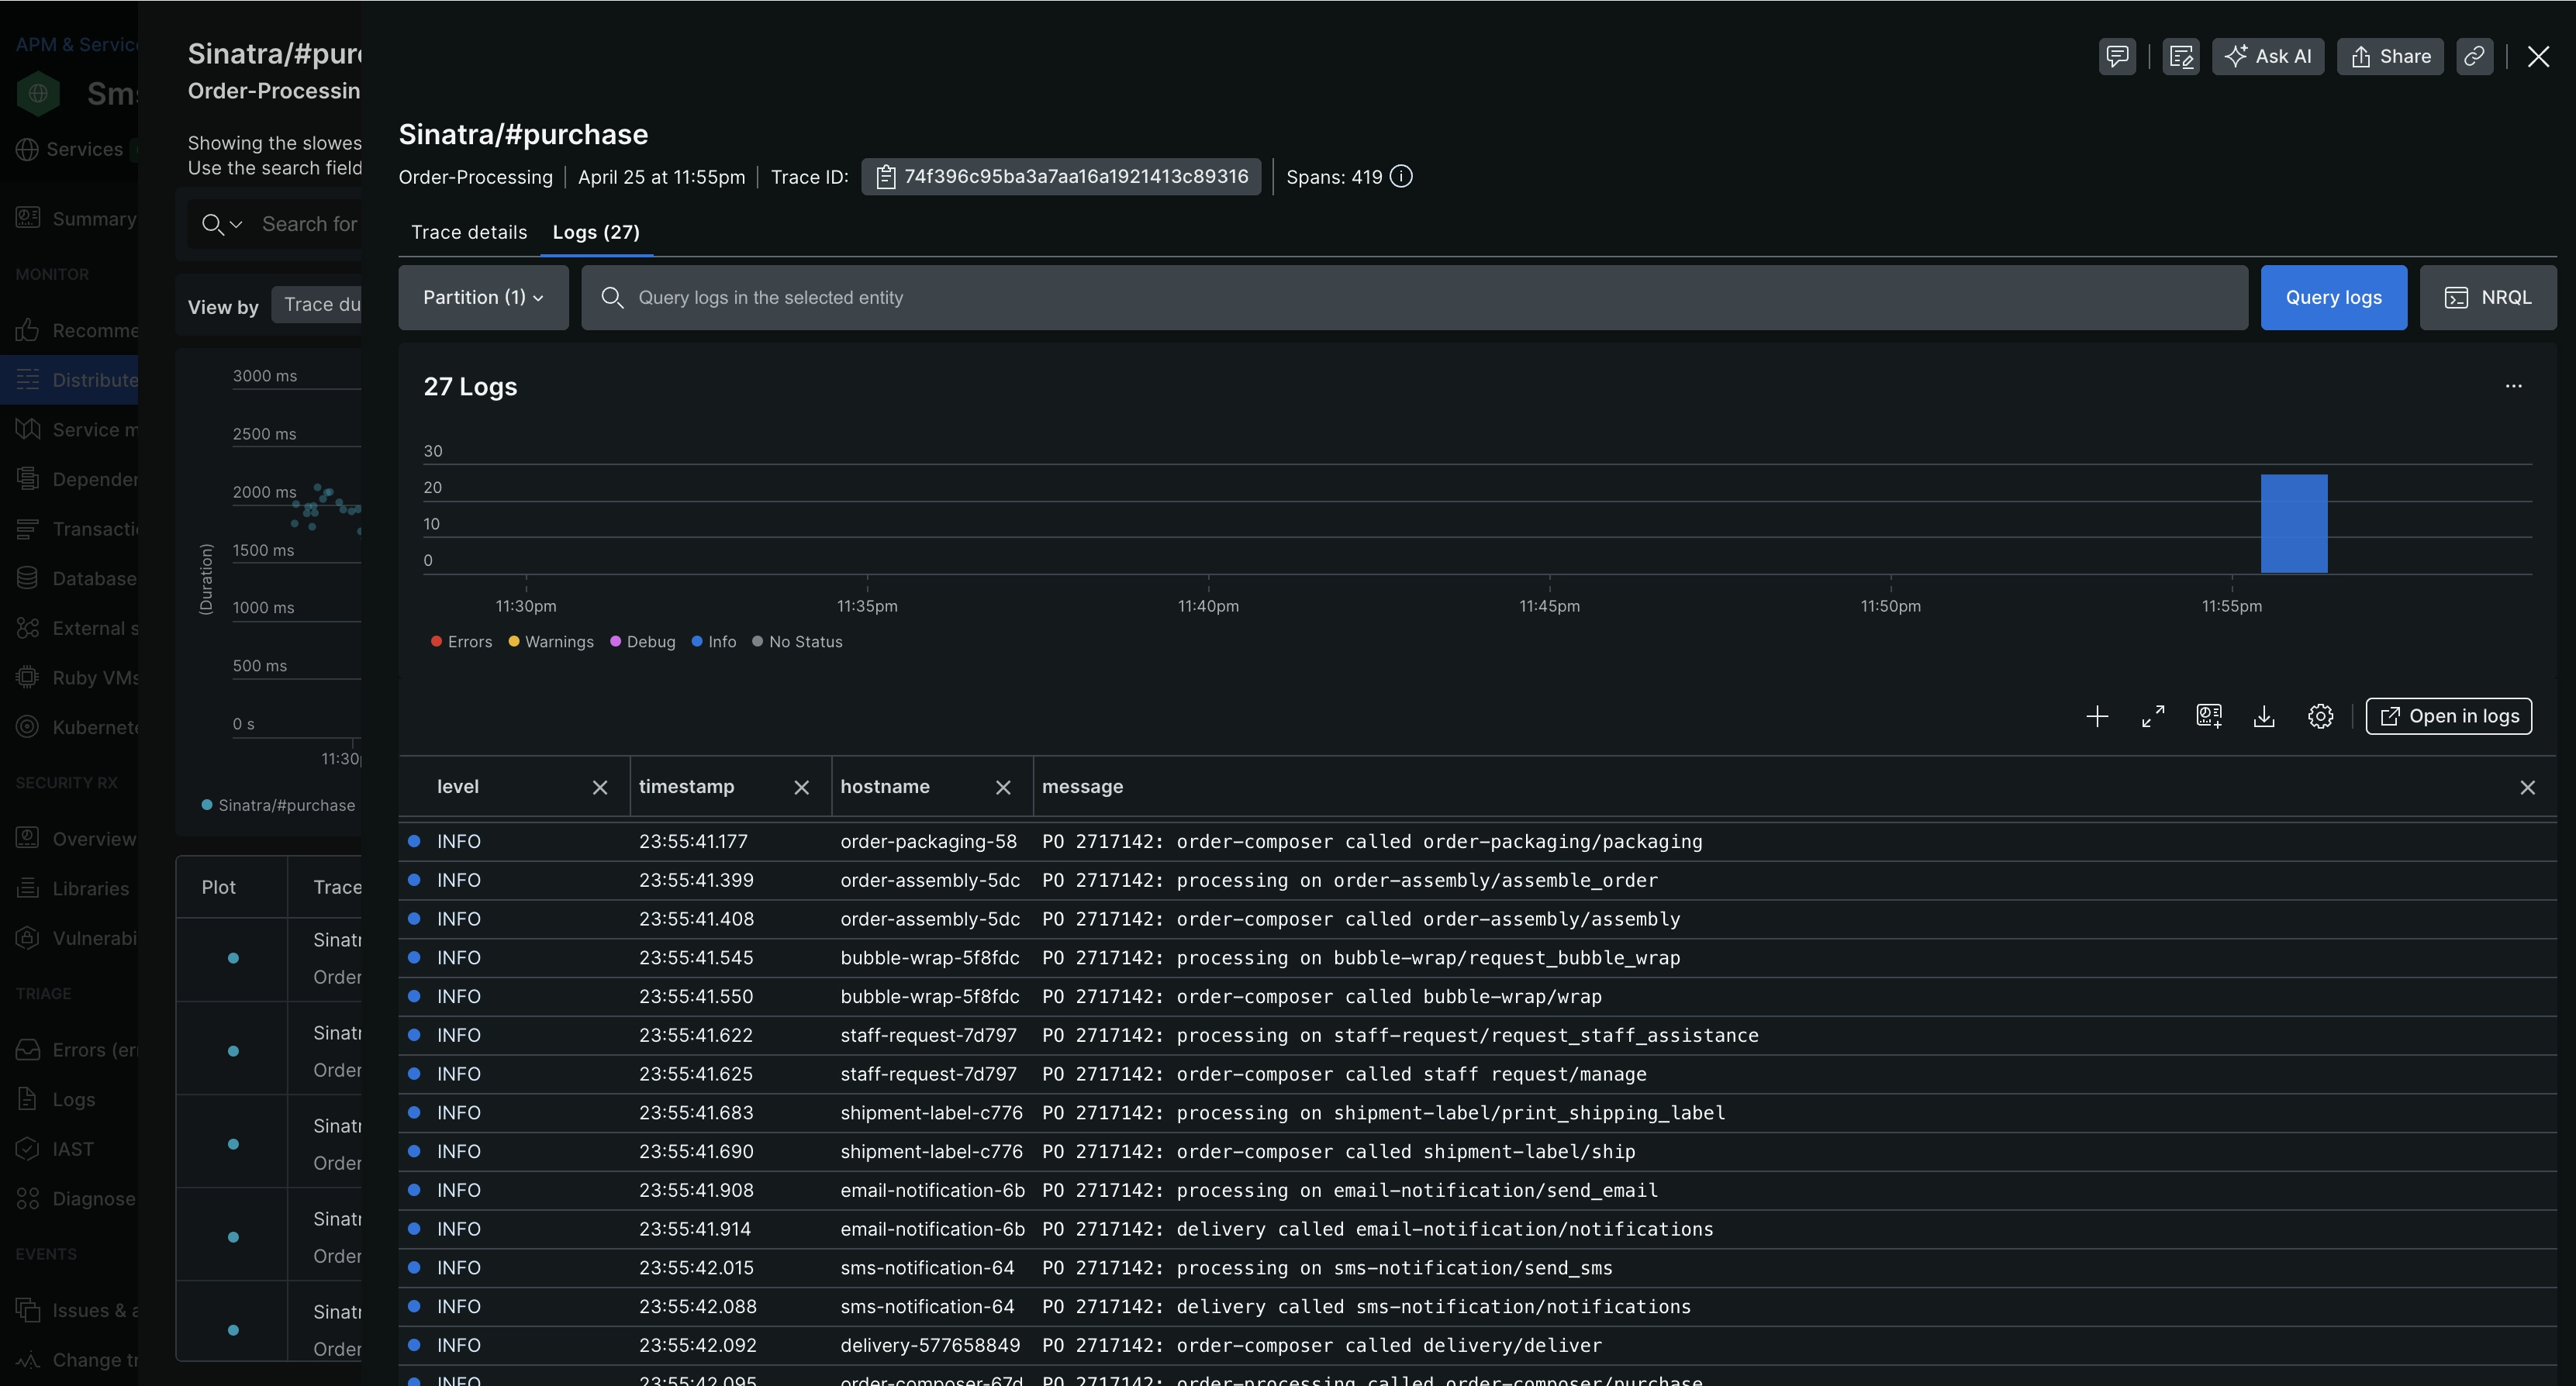
To troubleshoot latency this way, you must be able to see [logs in context](https://docs.newrelic.com/docs/logs/logs-context/configure-logs-context-apm-agents/). Then, to have a better understanding of how your systems were operating when performance noticeably slowed:
1. Go to **[one.newrelic.com > All capabilities](https://one.newrelic.com/all-capabilities) > APM & services > (select an app)**.
2. From the app's **Summary** page, click **Distributed tracing**, then select a particularly slow trace.
3. From the trace **Details**, click **Logs**.
## Links to logs in New Relic [#links]
Depending on your New Relic subscription, you can access your logs from several places in the New Relic UI. For some of these options, you must be able to see [logs in context](https://docs.newrelic.com/docs/logs/logs-context/configure-logs-context-apm-agents/).
> #### 💡 TIP
>
> Let your app's APM agent forward log data directly to New Relic with [APM logs in context](https://docs.newrelic.com/docs/apm/new-relic-apm/getting-started/get-started-logs-context). No need to install or maintain additional third-party software!
| To view logs... | Do this... |
| ---------------------------------- | -------------------------------------------------------------------------------------------------------------------------------------------------------------------------------------------------------------------------------------------------------------------------------------------------------------------------------------------------------------------------------------------------------------------------------------------------------------------------------------------------------------------------------------------------------------- |
| Directly from the logs UI | - Go to **[one.newrelic.com > All capabilities](https://one.newrelic.com/all-capabilities) > Logs**. - EU region data center [(if available)](https://docs.newrelic.com/docs/using-new-relic/welcome-new-relic/get-started/our-eu-us-region-data-centers/): Go to **[one.eu.newrelic.com/](https://one.eu.newrelic.com) > Logs**. - JP region data center [(if available)](https://docs.newrelic.com/docs/using-new-relic/welcome-new-relic/get-started/our-eu-us-region-data-centers/): Go to **[one.jp.newrelic.com/](https://one.jp.newrelic.com) > Logs**. |
| From your app in APM | Go to **[one.newrelic.com > All capabilities](https://one.newrelic.com/all-capabilities) > APM**, select an app, then use any of these options: - **Triage > Logs** - **Triage > Errors inbox > (select an error) > Logs** - **Events > Errors > (select an error) > See logs** |
| From distributed tracing | Go to **[one.newrelic.com > All capabilities](https://one.newrelic.com/all-capabilities) > APM & services > (select an app) > Distributed tracing > (select a trace) > Logs**. |
| From a host in your infrastructure | Go to **[one.newrelic.com > All capabilities](https://one.newrelic.com/all-capabilities) > Infrastructure**, select a host, and then click **Logs**. |
| From Kubernetes | From the Kubernetes UI, select a cluster, and then click **Logs**. |
| From an entity | Go to **[one.newrelic.com > All capabilities](https://one.newrelic.com/all-capabilities) > All entities > (select an entity) > Logs**. |
| From your IDE | [Install New Relic's CodeStream extension](https://docs.newrelic.com/docs/codestream/start-here/install-codestream) to view logs in your IDE. |