---
title: NRQL predictions
source: https://docs.newrelic.com/docs/query-your-data/explore-query-data/use-charts/nrql-predictions
---
## Overview [#purpose]
**NRQL predictions** in New Relic uses your time series' historical data patterns to predict or forecast future trends, providing insights into how metrics might behave in the future. This proactive approach helps you visualize trends and anticipate potential issues, enabling timely interventions to maintain optimal system performance. Predictions for your signal are generated by fitting a machine learning model to your historical data and using that model to predict into the future. This feature currently supports predictions for both seasonal (data that has a recurring, repeatable pattern on a set cadence) and non-seasonal time series. Metrics that exhibit a strong trend or defined seasonal pattern are best suited for predictions. These predictions are best utilized when added to existing dashboards to give a quick visual indicator as to where your metrics are headed.
> #### ⚠️ IMPORTANT
>
> **NRQL predictions** are only compatible with time series queries. For more details about writing time series queries, refer to the [NRQL syntax documentation on the `TIMESERIES` clause](https://docs.newrelic.com/docs/nrql/nrql-syntax-clauses-functions/#sel-timeseries).
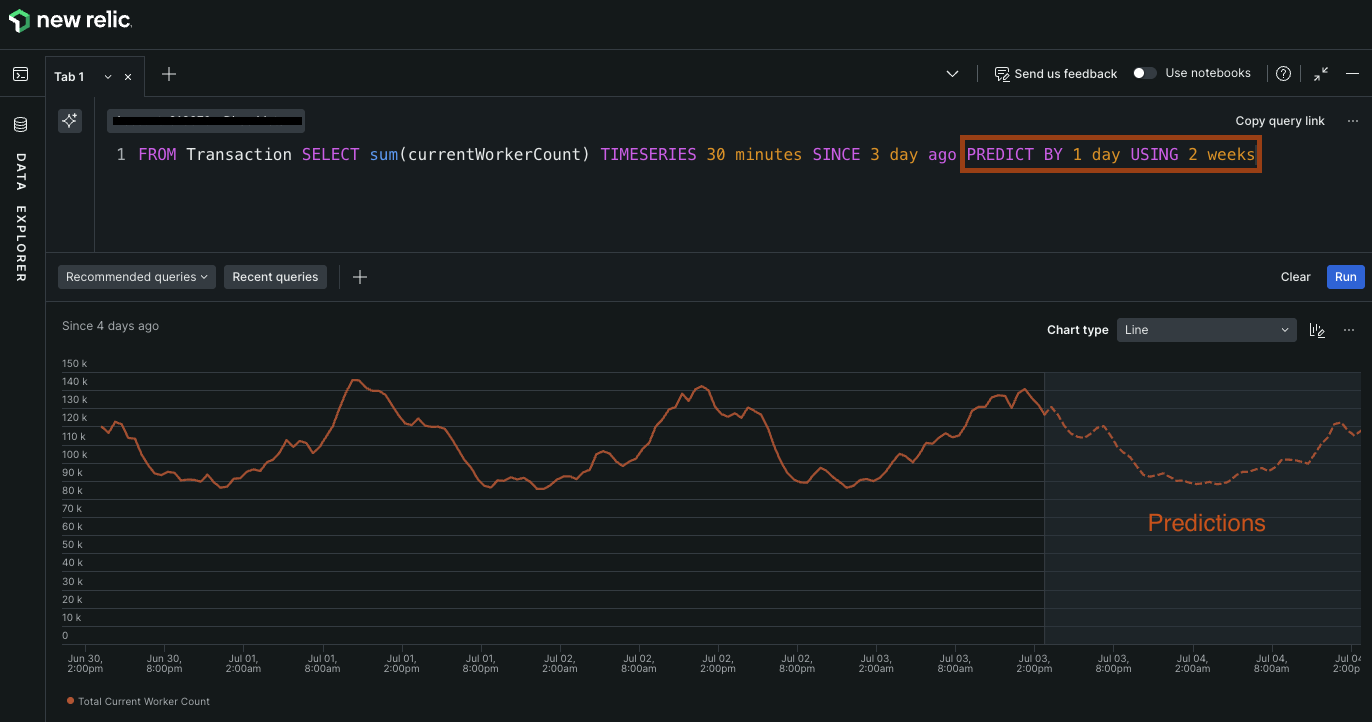
Predictions made using **NRQL predictions** (`PREDICT` clause) for a time series. In this example, forecasts are generated for one day into the future, based on the `BY` keyword. The model producing these predictions is trained on a total of 17 days of data: 3 days from the query window plus 2 weeks (14 days) from the `USING` keyword. Note that the chart does not display all the training data.
Examples of situations where you might want to add predictions to your chart or dashboard:
- Your application is producing more logs over the past few hours and the disk space is running out.
- Your application is steadily running out of memory, threatening to crash the entire container.
- You need to project future revenue based upon observed seasonal and trend patterns.
While **NRQL predictions** themselves do not identify potential issues, they equip you with the information you need to assess trends and plan for future challenges. To generate alerts when the predicted values indicate an impending problem, you can use the **[Predictive Alerts](https://docs.newrelic.com/docs/alerts/create-alert/set-thresholds/predictive-alerts)** feature. **Predictive Alerts** work alongside **NRQL predictions** to generate predictions for your metrics and alert when those predicted values pass a static threshold.
## Pricing [#pricing]
**NRQL predictions** is available to all customers and all users. [Core CCUs](https://docs.newrelic.com/docs/accounts/accounts-billing/new-relic-one-pricing-billing/new-relic-one-pricing-billing/#core-compute-capacity-unit) are consumed when NRQL queries are executed with the `PREDICT` clause.
## Usage [#usage]
**NRQL predictions** can be generated in two ways: either directly on charts you have already created or by writing a NRQL query using the `PREDICT` clause.
**Add predictions to an existing chart.**
You can add **NRQL predictions** only to charts that depict time series data, such as line or area charts. To add a **NRQL prediction** to an existing chart, perform the steps as follows:
#### Access a line or area chart [#access-a-chart]
1. Go to [one.newrelic.com > All capabilities](https://one.newrelic.com/all-capabilities).
2. To add predictions to a line or area chart, select it from **Dashboards**, or open it from **Metrics and events**.
#### Add predictions [#add-prediction]
To add a prediction to charts in dashboards, from the menu, select **Predict trend**. The **Predict trend** option is not available for charts in curated dashboards, which are system-generated and non-editable dashboards designed for specific services. So, from the menu, select **View Query** and add the `PREDICT` clause to the query.
In **Data Explorer**, the prediction appears on the chart highlighted in a gray area with a dashed line connecting the predicted values, representing the [**NRQL predictions** default behavior](#defaults). You can [refine the query](#customize-prediction-range) by fine-tuning according to your requirements and re-run it to get the updated predictions.
> #### 💡 TIP
>
> When you add predictions to an area chart, it changes to a line chart containing the predictions.
#### Add to dashboard [#add-to-dashboard]
To add a chart containing predictions to a dashboard:
1. Click **Add to dashboard**.
2. Enter a widget name.
3. Either select an existing dashboard or create a new one.
**Use the `PREDICT` clause.**
The NRQL syntax includes the `PREDICT` clause to streamline the use of **NRQL predictions**. For usage details and examples, refer to the [default behavior](#defaults) section.
Example of using `PREDICT` in a NRQL query:
```sql
FROM Transaction SELECT count(*) WHERE error IS TRUE TIMESERIES PREDICT
```
The default predictions on the chart appears as follows:
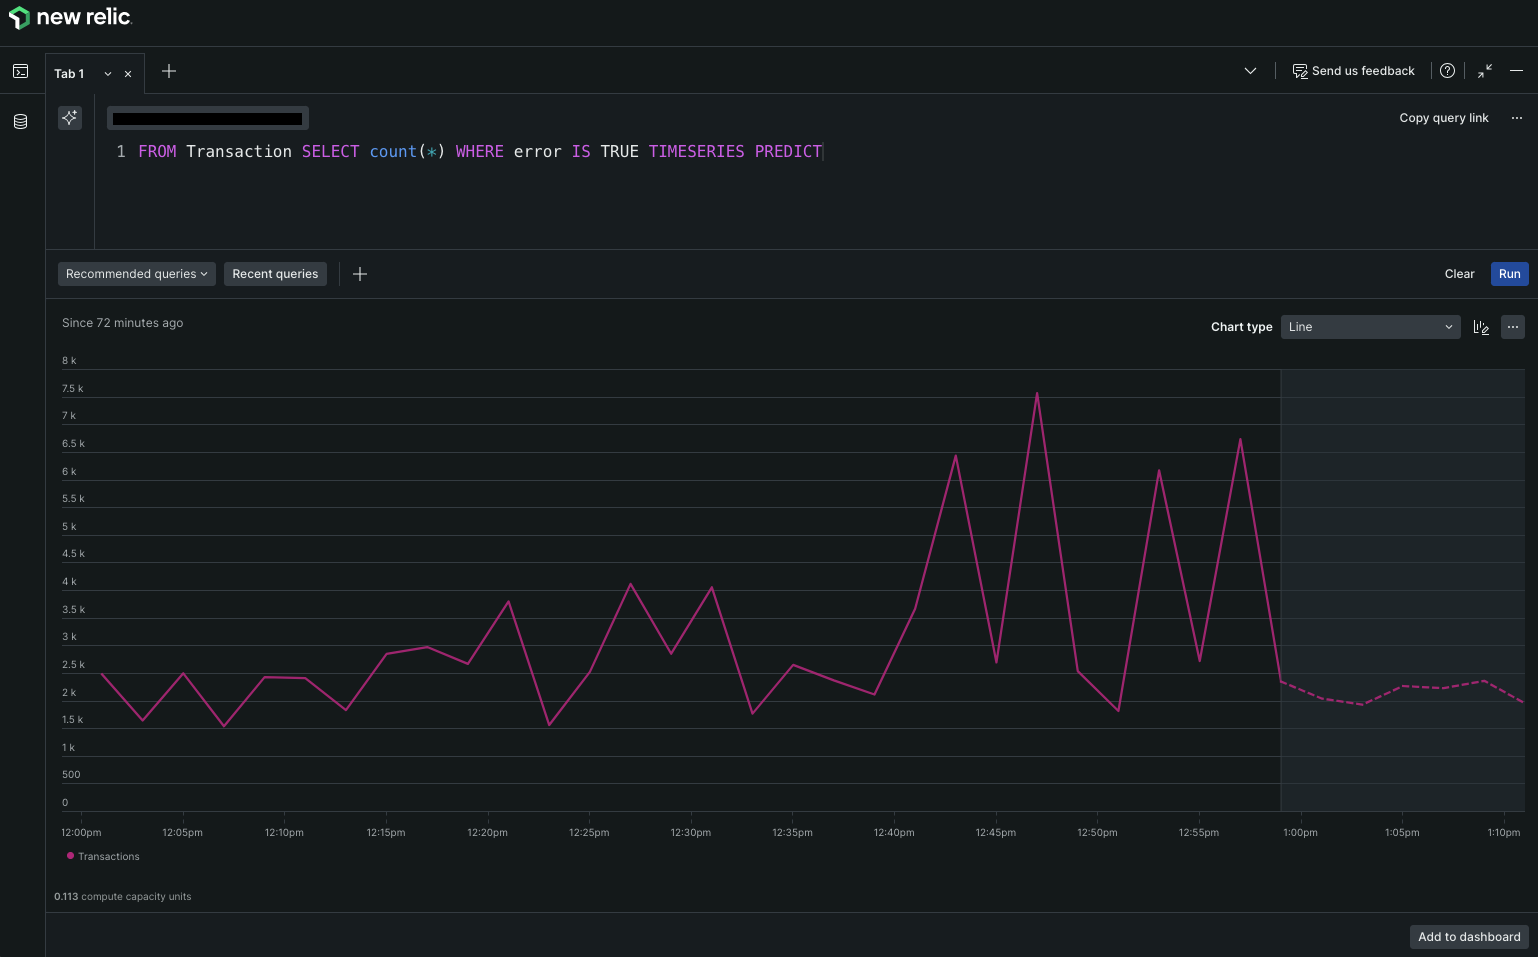
**[one.newrelic.com > All capabilities](https://one.newrelic.com/all-capabilities) > dashboards**: default predictions.
## Default behavior [#defaults]
> #### ⚠️ IMPORTANT
>
> The usage of the default `PREDICT` clause provides the best prediction results.
The `PREDICT` clause in a query comes with the following default behaviors which are dependent upon your query window duration (specified using the `SINCE` and `UNTIL` clauses):
| **Default behavior** | |
| -------------------------------------- | ------------------------------------------------------------------------------------------------------------------------------------------------------------------------------------------------------------------------------------------------------------------------------------------------------------------------------------------------------------------------------------------------------------------------------------------------------------------------------------------------------------------------------------------------------------------------------------------------------------------------------------------- |
| Seasonality | Automatically detects whether seasonality is present in the historic data. If seasonality is detected, the identified season length is used to generate a seasonal model, otherwise a non-seasonal model is used. We currently support seasonal lengths of hourly, daily, and weekly. For more details on seasonality, refer to the [algorithm](#algorithm) section. |
| Algorithm hyperparameters | Hyperparameters are automatically optimized and selected based on the historical data. |
| Amount of historical data for training | Uses historical data from the last three query windows (the current one and the two preceding it). For example, if your query window is one hour in length, a total of three hours will be used for training. The chart displays only the data from the current query window, not the entire training data. - If you want to only display a certain length of time in the query window but use more data for training, you can use the [`USING` clause](/#using). - If a seasonality other than the default is specified, the amount of training data used will be different. For more details, refer to the [seasonal](#seasonal) section. |
| Prediction window | Predicts a range equal to 20% of the total time span specified in your query window. For example, if your query window is one hour, the predictions will be for the next 12 minutes. You can override this default with the [`BY` clause](#customize-model). |
**Examples of queries with the default `PREDICT` clause.**
Example queries and what the expected output is when `PREDICT` is used:
**Example 1:**
```sql
FROM Transaction SELECT sum(currentWorkerCount) TIMESERIES PREDICT
```
Returns a time series chart with a default query window of one hour and predictions for the next 12 minutes. A total three hours of historical data is used for training (1 hour from the query window and 2 hours from the preceding 2 query windows).
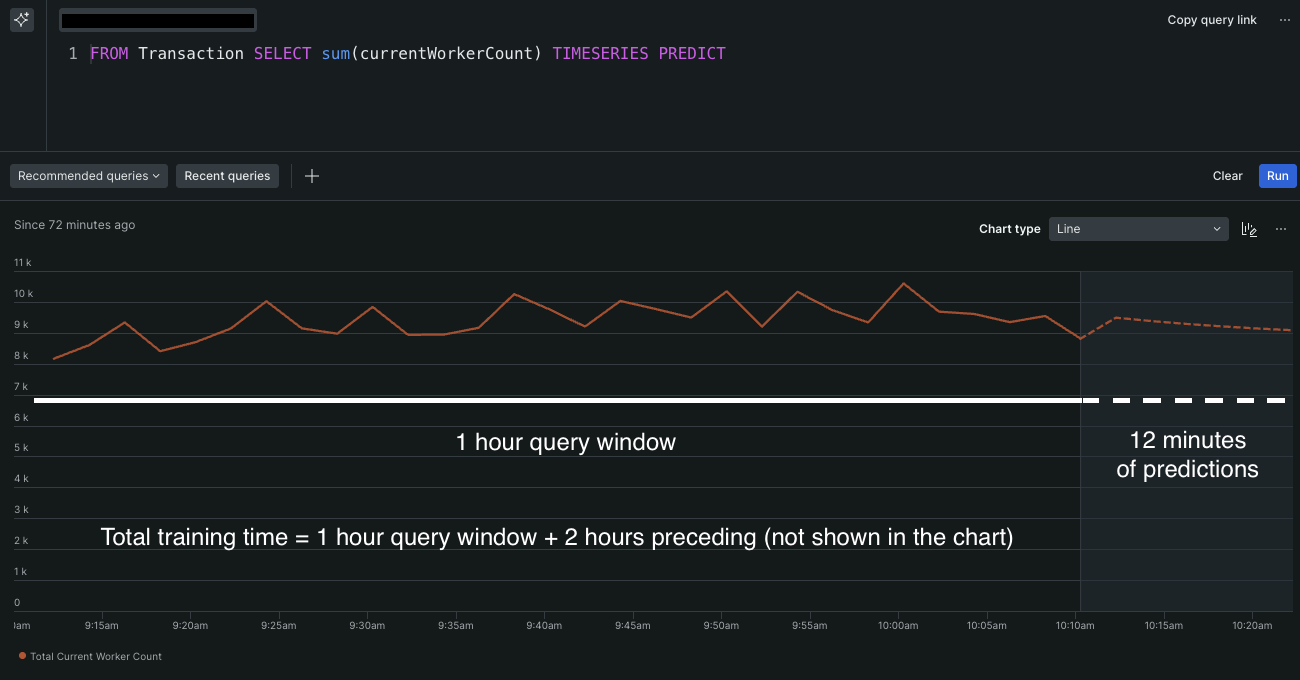
Example 1
**Example 2:**
```sql
FROM Transaction SELECT sum(currentWorkerCount) TIMESERIES SINCE 3 hours ago UNTIL 1 hour ago PREDICT
```
Returns a time series chart with a query window of two hours (based upon the `SINCE` and `UNTIL` clauses) and predictions for the next 24 minutes. A total six hours of historical data is used for training (two hours from the query window and four hours from the preceding two query windows).
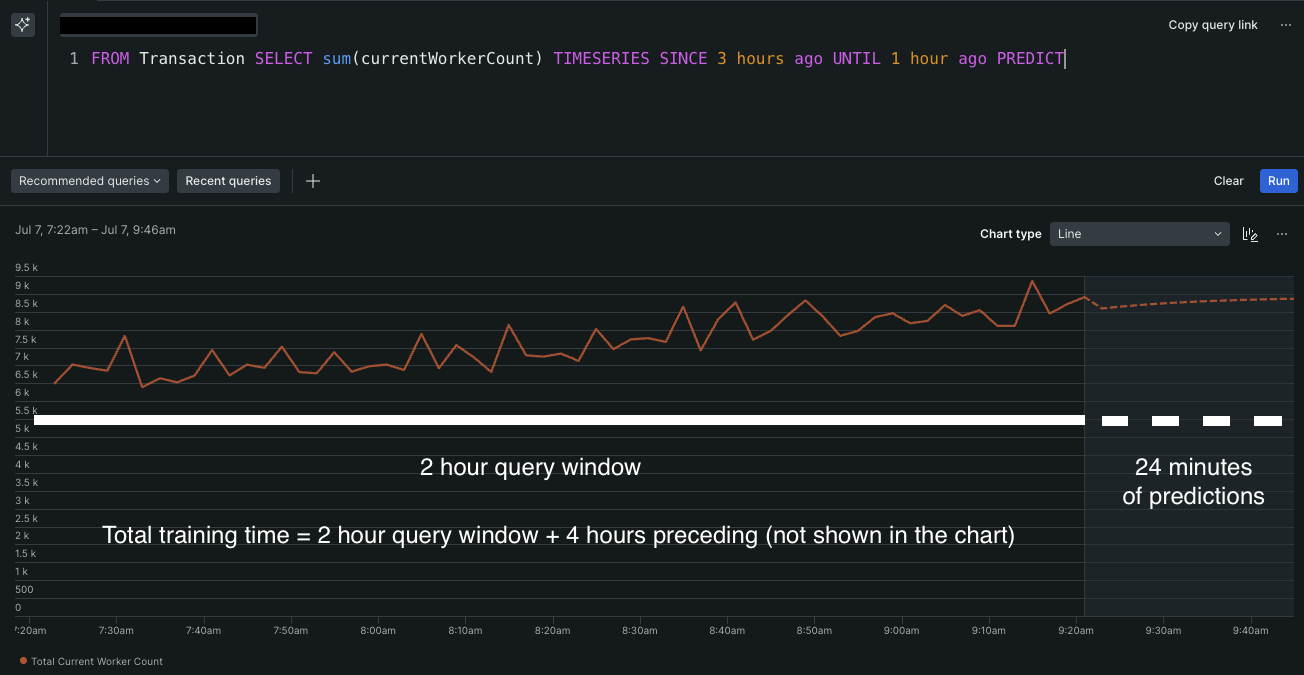
Example 2
## Customizing the predictions with `BY`, `USING` and `SLIDE BY` [#customize-model]
You can customize the predictions by manually setting the model's seasonality and adding the `BY`, `USING` and `SLIDE BY` keywords.
**Add the `BY` keyword.**
Use the `BY` keyword to set how far ahead in time you want the model to predict. For example, `PREDICT BY 3 hours` generates predictions up to three hours into the future from the latest point in the time series. Make sure the time span is an `integer unit` of time. The maximum amount you can predict is 360 time windows (i.e., your time series window size times 360).
Example query with `BY` keyword that will generate predictions for the next 30 minutes:
````sql
FROM Transaction SELECT count(*) WHERE error IS TRUE TIMESERIES PREDICT BY 30 minutes
```
 Example of predictions made with the BY keyword.}
alt="Example with BY"
src="/images/nrql-prediction-example-by.webp"
/>
{<>Example of predictions made with the BY keyword. The boxed in area indicates what section of the chart is effected by the BY keyword.}
````
**Add the `USING` keyword.**
Use the `USING` keyword to specify the amount of historical data you want to use to train the model. The total amount of data used is the sum of the query window duration (specified with the `SINCE` and `UNTIL` clauses) and value specified with the `USING` clause. For example, `PREDICT USING 1 day` uses the query window plus the data from the preceding day to train the model. Make sure the time span is an `integer unit` of time.
You can use up to 3,660 data points to train a model. If you exceed this limit, you'll receive an error message. You can determine how much time this represents by using the time series window. For example, with a 1-minute time window, you can use up to 3,660 minutes of training data, which equals 61 hours, or about 2.5 days.
Example query with the `USING` keyword with `SINCE`:
````sql
FROM Transaction SELECT sum(currentWorkerCount) SINCE 1 week ago TIMESERIES MAX PREDICT USING 2 weeks
```
Example of predictions made with the BY keyword.}
alt="Example with BY"
src="/images/nrql-prediction-example-by.webp"
/>
{<>Example of predictions made with the BY keyword. The boxed in area indicates what section of the chart is effected by the BY keyword.}
````
**Add the `USING` keyword.**
Use the `USING` keyword to specify the amount of historical data you want to use to train the model. The total amount of data used is the sum of the query window duration (specified with the `SINCE` and `UNTIL` clauses) and value specified with the `USING` clause. For example, `PREDICT USING 1 day` uses the query window plus the data from the preceding day to train the model. Make sure the time span is an `integer unit` of time.
You can use up to 3,660 data points to train a model. If you exceed this limit, you'll receive an error message. You can determine how much time this represents by using the time series window. For example, with a 1-minute time window, you can use up to 3,660 minutes of training data, which equals 61 hours, or about 2.5 days.
Example query with the `USING` keyword with `SINCE`:
````sql
FROM Transaction SELECT sum(currentWorkerCount) SINCE 1 week ago TIMESERIES MAX PREDICT USING 2 weeks
```
 Example of predictions made with the USING keyword.}
alt="Example with USING"
src="/images/nrql-prediction-example-using.webp"
/>
{<>Example of predictions made with the USING keyword. The USING keyword effects the amount of data used for training which is not visualized on the chart.}
````
**Add the `SLIDE BY` keyword.**
Use the `SLIDE BY` keyword to reduce noise in your data when your forecast shows a lot of variation over short periods. This clause aggregates the data into overlapping time windows with a specified slide interval, smoothing out spikes in the chart and making it easier to identify trends.
Example query with the `SLIDE BY` keyword:
````sql
FROM Transaction SELECT count(*) PREDICT TIMESERIES 5 minutes SLIDE BY 1 minute
```
````
## Algorithm [#algorithm]
Currently, **NRQL predictions** supports the **[Holt-Winters](https://en.wikipedia.org/wiki/Exponential_smoothing#Triple_exponential_smoothing_(Holt_Winters))** algorithm, also known as exponential smoothing, for both seasonal and non-seasonal time series. This is a commonly used and standard algorithm for forecasting and time series predictions.
### Non-seasonal [#non-seasonal]
For non-seasonal time series, only the level (average value) and trend (average increase or decrease) are modeled. Non-seasonal predictions are linear, so a flat line with or without a trend is expected.
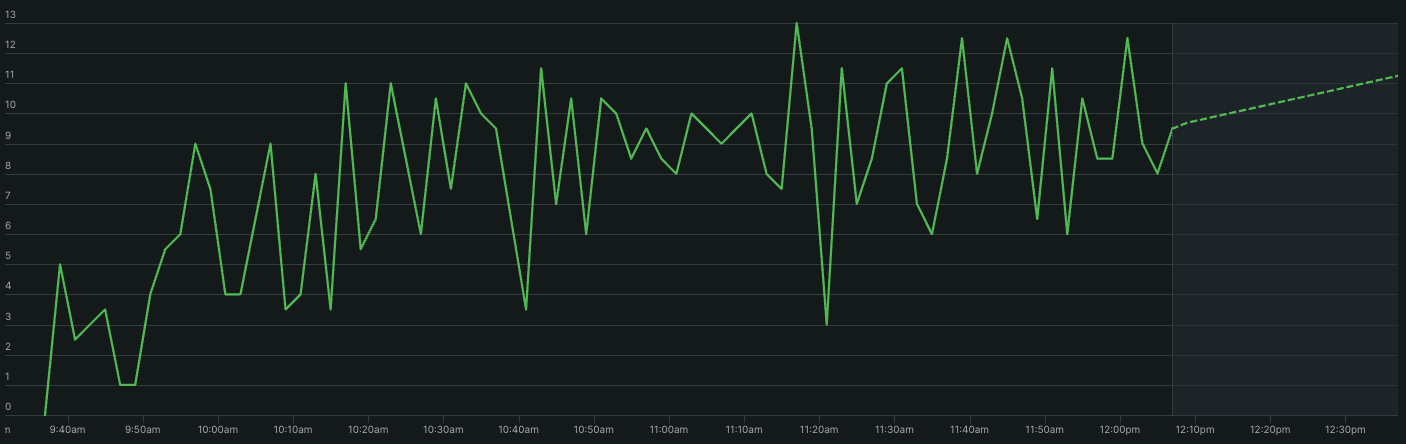
Predictions generated using **NRQL predictions** for a non-seasonal time series.
### Seasonal [#seasonal]
For seasonal time series, the seasonal pattern is included in addition to the level and the trend. Seasonality represents a repeatable pattern that occurs on some periodic basis. We support automatic season detection of hourly, daily, and weekly seasonal lengths by default for the Holt-Winters model. In order to detect each seasonal length, you must ensure that you are providing enough data through a combination of the query window duration (specified using the `SINCE` and `UNTIL` clauses) and the `USING` clause. The minimum amount of data required for each seasonal length is specified below. By default, when no `USING` clause is used, **NRQL predictions** will use three times the query window to generate predictions.
| **Detectable seasonalities** | **Description** | **Minimum amount of required data** |
| ---------------------------- | ---------------------------------------------------------------------------------------------------------------------------------------------------------- | ----------------------------------- |
| Hourly | Each timestamp within the hour behaves the same as in the previous hours. For example, 3:20pm will behave just like 2:20pm, 1:20pm, etc.. | 2 hours |
| Daily | Each hour behaves the same as the previous day's hours. For example, 3pm today will behave the same as 3pm yesterday. | 2 days |
| Weekly | Each day of the week will behave the same as it did in the previous weeks. For example, Monday this week will behave the same as Monday in previous weeks. | 2 weeks |
You can specify custom seasonal lengths using the `seasonality` parameter.
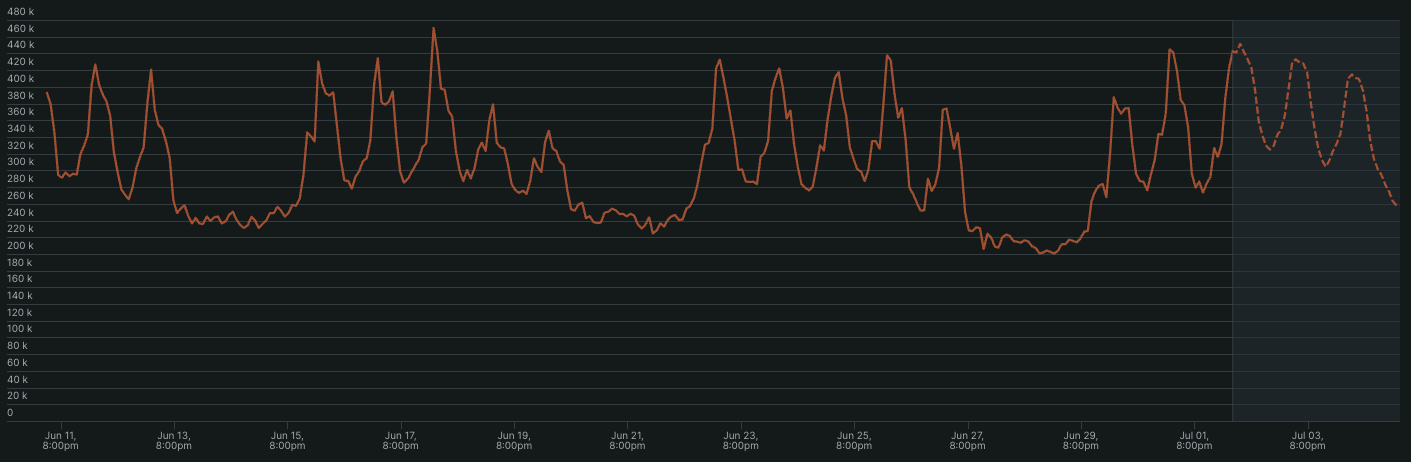
Predictions generated using **NRQL predictions** for a time series with weekly seasonality.
**Setting custom seasonality.**
We currently support predictions using non-seasonal and seasonal versions of Holt-Winters. To set a custom seasonality, use the `holtwinters(seasonality: )` parameter to the `PREDICT` clause.
| **Option** | **Description** |
| ----------------- | -------------------------------------------------------------------------------------------------------------------------------------------------------------------------------------------------------------------------------------------------------------------------------------------------------------------------------------------------------- |
| `` | Specifies that a seasonal model with the provided season length will be used for predictions. The season length must be an `integer unit` of time (i.e., `1 day` or `3 hours`) that represents the length of a single seasonal period. For example, a value of `1 hour` is equivalent to hourly seasonality, `1 day` for daily, and `1 week` for weekly. |
| `AUTO` | Uses automatic season detection. It analyzes historical data in the training window to fit both non-seasonal and seasonal models. The season length for the seasonal model is chosen based upon the strongest seasonality detected in the training window. After both models are trained, the best fitting one is selected and used to make predictions. |
| `NONE` | Specifies that a non-seasonal model will be used. |
> #### ⚠️ IMPORTANT
>
> If a season length is specified and the `USING` clause is used, the amount of data used for training will be equal to the query window plus the `USING` amount. If no `USING` is specified, the maximum of the seasonal length and three times the query window will be used.
Example query with user specified seasonality:
````sql
FROM Transaction SELECT count(*) WHERE error IS TRUE TIMESERIES PREDICT holtwinters(seasonality: 1 hour)
```
Example query specifying a non-seasonal model:
```sql
FROM Transaction SELECT count(*) WHERE error IS TRUE TIMESERIES PREDICT holtwinters(seasonality: NONE)
```
Example query specifying an automatic season detection (this is the same behavior as the default of not using the `holtwinters(...)` parameter):
```sql
FROM Transaction SELECT count(*) WHERE error IS TRUE TIMESERIES PREDICT holtwinters(seasonality: AUTO)
```
````
## Advanced usage [#advanced-usage]
**Set optional Holt-Winters model hyperparameters.**
> #### ⚠️ IMPORTANT
>
> Adjusting the model parameters is intended for advanced users who want fine-grain control over the model and for recreating predictions generated with [Predictive Alerts](https://docs.newrelic.com/docs/alerts/create-alert/set-thresholds/predictive-alerts).
Currently, **Holt-Winters** is the only supported prediction algorithm and there are several hyperparameters that can be adjusted to fine-tune your predictions. The hyperparameters can be modified by adding `holtwinters(: )` after the `PREDICT` clause in your query. Any combination of the following parameters can be added to modify how the model is fit to the historical data:
| **Hyperparameter** | **Description** | **Allowed values** |
| ------------------ | --------------------------------------------------------------------------------------------------------------------------------------------------------------------------------------------------------------------------------------------------------- | ------------------------------------------------------------------------------- |
| `alpha` | The level smoothing factor where a larger value gives more weight to recent values. | `[0, 1.0]` |
| `beta` | The trend smoothing factor where a larger value gives more weight to recent values. | `[0, 1.0]` |
| `gamma` | The season smoothing factor where a larger value gives more weight to recent values. This parameter is not compatible with non-seasonal models and the query will return an error if you try to specify `holtwinters(seasonality: NONE, gamma: )`. | `[0, 1.0]` |
| `phi` | The trend damping parameter where a smaller value indicates more damping of the trend and a prediction that will flatten out. | `[0, 1.0]` It is recommended to use values only in the range of (`[0.98, 1.0]`) |
Example query with hyperparameter modifications:
```sql
FROM Transaction SELECT count(*) WHERE error IS TRUE TIMESERIES PREDICT holtwinters(alpha: 0.2, beta: 0.5, gamma: 0.5, phi: 0.99)
```
Example query with the `PREDICT` clause specifying the seasonality, custom hyperparameters, and adding the `BY` and `USING` keywords:
```sql
FROM Transaction SELECT count(*) WHERE error IS TRUE TIMESERIES PREDICT holtwinters(seasonality: AUTO, alpha: 0.2) BY 1 hour USING 2 hours
```
This query sets the seasonality to automatic detection and emphasizes historical data by adjusting the level smoothing factor. It predicts one hour into the future and trains the model using the query window length along with the previous two hours of historical data. The chart displays the customized predictions as follows:
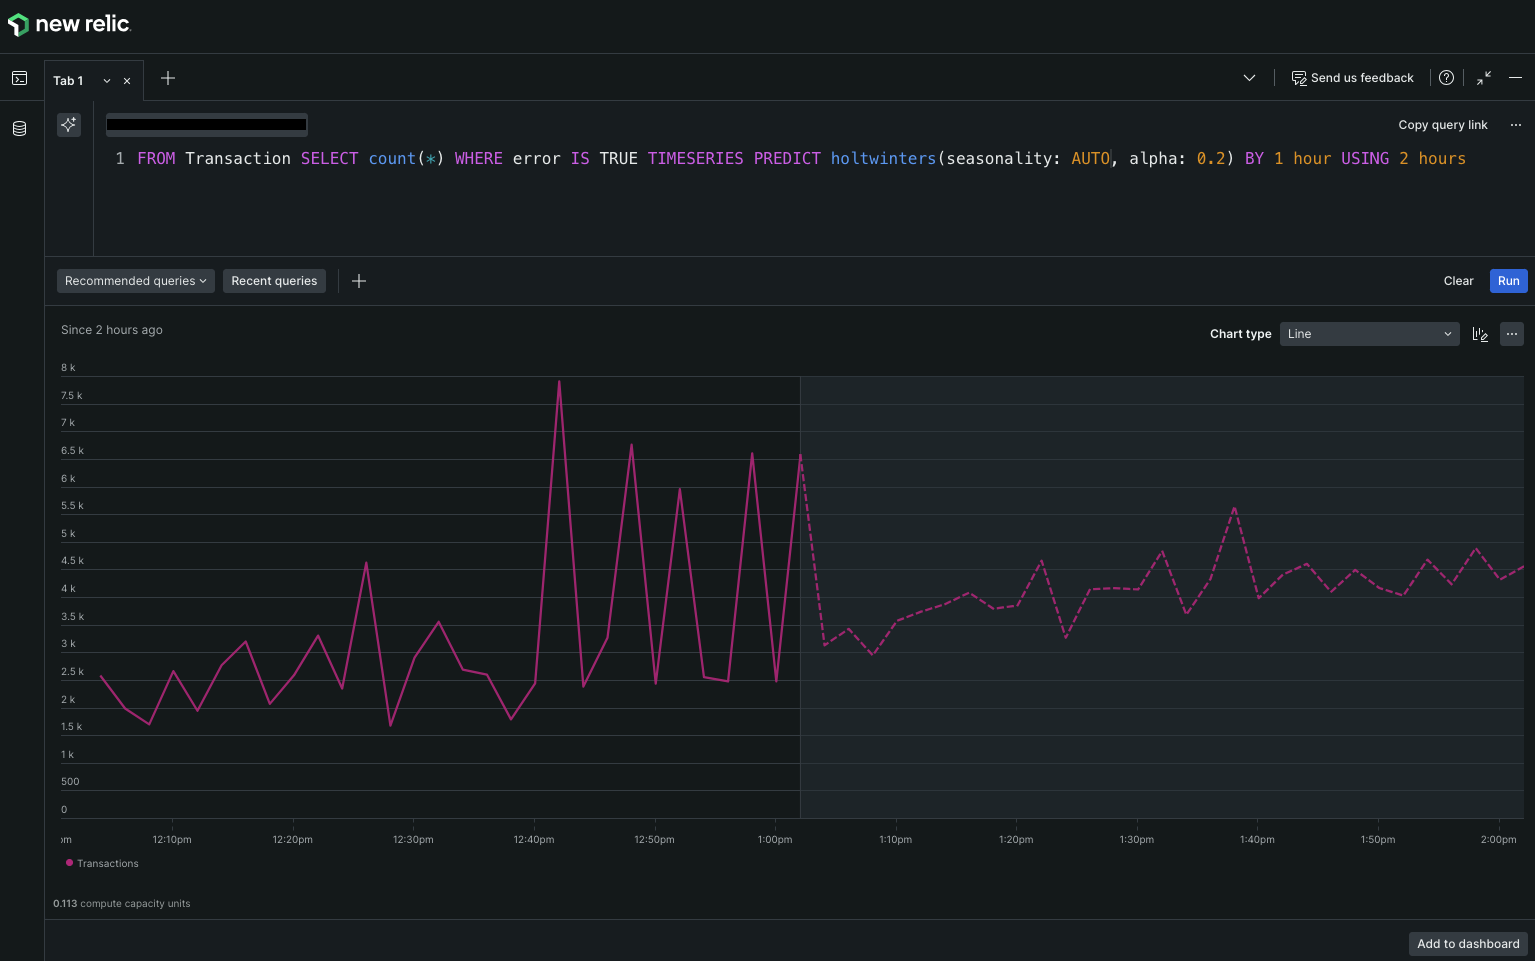
**[one.newrelic.com > All capabilities](https://one.newrelic.com/all-capabilities) > dashboards**: customized prediction.
Example of predictions made with the USING keyword.}
alt="Example with USING"
src="/images/nrql-prediction-example-using.webp"
/>
{<>Example of predictions made with the USING keyword. The USING keyword effects the amount of data used for training which is not visualized on the chart.}
````
**Add the `SLIDE BY` keyword.**
Use the `SLIDE BY` keyword to reduce noise in your data when your forecast shows a lot of variation over short periods. This clause aggregates the data into overlapping time windows with a specified slide interval, smoothing out spikes in the chart and making it easier to identify trends.
Example query with the `SLIDE BY` keyword:
````sql
FROM Transaction SELECT count(*) PREDICT TIMESERIES 5 minutes SLIDE BY 1 minute
```
````
## Algorithm [#algorithm]
Currently, **NRQL predictions** supports the **[Holt-Winters](https://en.wikipedia.org/wiki/Exponential_smoothing#Triple_exponential_smoothing_(Holt_Winters))** algorithm, also known as exponential smoothing, for both seasonal and non-seasonal time series. This is a commonly used and standard algorithm for forecasting and time series predictions.
### Non-seasonal [#non-seasonal]
For non-seasonal time series, only the level (average value) and trend (average increase or decrease) are modeled. Non-seasonal predictions are linear, so a flat line with or without a trend is expected.

Predictions generated using **NRQL predictions** for a non-seasonal time series.
### Seasonal [#seasonal]
For seasonal time series, the seasonal pattern is included in addition to the level and the trend. Seasonality represents a repeatable pattern that occurs on some periodic basis. We support automatic season detection of hourly, daily, and weekly seasonal lengths by default for the Holt-Winters model. In order to detect each seasonal length, you must ensure that you are providing enough data through a combination of the query window duration (specified using the `SINCE` and `UNTIL` clauses) and the `USING` clause. The minimum amount of data required for each seasonal length is specified below. By default, when no `USING` clause is used, **NRQL predictions** will use three times the query window to generate predictions.
| **Detectable seasonalities** | **Description** | **Minimum amount of required data** |
| ---------------------------- | ---------------------------------------------------------------------------------------------------------------------------------------------------------- | ----------------------------------- |
| Hourly | Each timestamp within the hour behaves the same as in the previous hours. For example, 3:20pm will behave just like 2:20pm, 1:20pm, etc.. | 2 hours |
| Daily | Each hour behaves the same as the previous day's hours. For example, 3pm today will behave the same as 3pm yesterday. | 2 days |
| Weekly | Each day of the week will behave the same as it did in the previous weeks. For example, Monday this week will behave the same as Monday in previous weeks. | 2 weeks |
You can specify custom seasonal lengths using the `seasonality` parameter.

Predictions generated using **NRQL predictions** for a time series with weekly seasonality.
**Setting custom seasonality.**
We currently support predictions using non-seasonal and seasonal versions of Holt-Winters. To set a custom seasonality, use the `holtwinters(seasonality: )` parameter to the `PREDICT` clause.
| **Option** | **Description** |
| ----------------- | -------------------------------------------------------------------------------------------------------------------------------------------------------------------------------------------------------------------------------------------------------------------------------------------------------------------------------------------------------- |
| `` | Specifies that a seasonal model with the provided season length will be used for predictions. The season length must be an `integer unit` of time (i.e., `1 day` or `3 hours`) that represents the length of a single seasonal period. For example, a value of `1 hour` is equivalent to hourly seasonality, `1 day` for daily, and `1 week` for weekly. |
| `AUTO` | Uses automatic season detection. It analyzes historical data in the training window to fit both non-seasonal and seasonal models. The season length for the seasonal model is chosen based upon the strongest seasonality detected in the training window. After both models are trained, the best fitting one is selected and used to make predictions. |
| `NONE` | Specifies that a non-seasonal model will be used. |
> #### ⚠️ IMPORTANT
>
> If a season length is specified and the `USING` clause is used, the amount of data used for training will be equal to the query window plus the `USING` amount. If no `USING` is specified, the maximum of the seasonal length and three times the query window will be used.
Example query with user specified seasonality:
````sql
FROM Transaction SELECT count(*) WHERE error IS TRUE TIMESERIES PREDICT holtwinters(seasonality: 1 hour)
```
Example query specifying a non-seasonal model:
```sql
FROM Transaction SELECT count(*) WHERE error IS TRUE TIMESERIES PREDICT holtwinters(seasonality: NONE)
```
Example query specifying an automatic season detection (this is the same behavior as the default of not using the `holtwinters(...)` parameter):
```sql
FROM Transaction SELECT count(*) WHERE error IS TRUE TIMESERIES PREDICT holtwinters(seasonality: AUTO)
```
````
## Advanced usage [#advanced-usage]
**Set optional Holt-Winters model hyperparameters.**
> #### ⚠️ IMPORTANT
>
> Adjusting the model parameters is intended for advanced users who want fine-grain control over the model and for recreating predictions generated with [Predictive Alerts](https://docs.newrelic.com/docs/alerts/create-alert/set-thresholds/predictive-alerts).
Currently, **Holt-Winters** is the only supported prediction algorithm and there are several hyperparameters that can be adjusted to fine-tune your predictions. The hyperparameters can be modified by adding `holtwinters(: )` after the `PREDICT` clause in your query. Any combination of the following parameters can be added to modify how the model is fit to the historical data:
| **Hyperparameter** | **Description** | **Allowed values** |
| ------------------ | --------------------------------------------------------------------------------------------------------------------------------------------------------------------------------------------------------------------------------------------------------- | ------------------------------------------------------------------------------- |
| `alpha` | The level smoothing factor where a larger value gives more weight to recent values. | `[0, 1.0]` |
| `beta` | The trend smoothing factor where a larger value gives more weight to recent values. | `[0, 1.0]` |
| `gamma` | The season smoothing factor where a larger value gives more weight to recent values. This parameter is not compatible with non-seasonal models and the query will return an error if you try to specify `holtwinters(seasonality: NONE, gamma: )`. | `[0, 1.0]` |
| `phi` | The trend damping parameter where a smaller value indicates more damping of the trend and a prediction that will flatten out. | `[0, 1.0]` It is recommended to use values only in the range of (`[0.98, 1.0]`) |
Example query with hyperparameter modifications:
```sql
FROM Transaction SELECT count(*) WHERE error IS TRUE TIMESERIES PREDICT holtwinters(alpha: 0.2, beta: 0.5, gamma: 0.5, phi: 0.99)
```
Example query with the `PREDICT` clause specifying the seasonality, custom hyperparameters, and adding the `BY` and `USING` keywords:
```sql
FROM Transaction SELECT count(*) WHERE error IS TRUE TIMESERIES PREDICT holtwinters(seasonality: AUTO, alpha: 0.2) BY 1 hour USING 2 hours
```
This query sets the seasonality to automatic detection and emphasizes historical data by adjusting the level smoothing factor. It predicts one hour into the future and trains the model using the query window length along with the previous two hours of historical data. The chart displays the customized predictions as follows:

**[one.newrelic.com > All capabilities](https://one.newrelic.com/all-capabilities) > dashboards**: customized prediction.