---
title: Create and edit SLIs and SLOs
source: https://docs.newrelic.com/docs/service-level-management/create-slm
---
You can create SLIs and SLOs manually through the [New Relic UI](https://one.newrelic.com). Alternatively, you can automate the process with our [NerdGraph API](https://docs.newrelic.com/docs/apis/nerdgraph/examples/nerdgraph-slm/) and the [Terraform Service Level resource](https://registry.terraform.io/providers/newrelic/newrelic/latest/docs/resources/service_level).
## Requirements and limitations [#requirements]
To create and manage service levels requires the following:
- You must be a [full platform user](https://docs.newrelic.com/docs/accounts/accounts-billing/new-relic-one-user-management/user-type).
- You must have the [capability for modifying and deleting events-to-metrics](https://docs.newrelic.com/docs/accounts/accounts-billing/new-relic-one-user-management/user-permissions#insights).
If you get the following errors, check your user permissions:
- The UI has disabled the option to save an SLI/SLO.
- The API returns the error message “Cannot query field `\"eventExportRegisterRule\"` on type `\"RootMutationType\".”`.
For New Relic organizations that have [multiple accounts](https://docs.newrelic.com/docs/accounts/accounts-billing/account-structure/new-relic-account-structure): Service levels can only be associated with a single account. If you're trying to create a service level for a workload with entities across multiple accounts, you may want to restructure the workloads so that all of their associated entities are in the same account. You can create a maximum of 500 SLIs on an account.
New Relic ingests data in many different ways and from very different sources. Each has its own individual flavor, creating many possibilities on how data is consumed. There are some scenarios where it is impossible to configure service levels due to the characteristics of the data:
- **Subqueries**. Subqueries are not supported.
- **Addition of sum functions**. While it's possible to use `SELECT sum(attributeA)` or `SELECT sum(attributeA + attributeB)`, the expression `SELECT sum(attributeA) + sum(attributeB)` is not supported.
## Key concepts for creating SLIs and SLOs [#key-concepts]
Keep in mind these concepts when defining SLIs and SLOs.
### Define your key user experiences [#define-user-exp]
Start by thinking of the highest-level key user experiences your team owns, then focus on underlying key user experiences until more granularity doesn't provide value. When choosing which SLs to start with, we recommend using a top-down approach, meaning start with the least granular ones, and create more granular ones only if necessary.
First of all, identify a "system boundary." This is a part of your system your users perceive as a "black box" of functionality. Some examples:
- In the case of an API, it might simply be a service.
- For a data pipeline, it might be a chain of services necessary to process data end-to-end.
Once you have established these top-level service levels, you might find that not all the endpoints of your service behave in the same way, and might want to split it further. For example:
- Login transactions might need a higher SLO on errors than a browsing one
- Duration of some operations is much higher than the rest
For example, at a high level, a key user experience at New Relic could be: _a customer sends us telemetry data and that data is later available to be queried in our product API or UI._
For that user experience, we could create an SLO like:
| period | target | category | indicator |
| ------------ | ------ | -------- | ------------------------------------------------------------------- |
| last 28 days | 99.9% | latency | data ingested by a user is available to query in less than 1 minute |
Note, these kinds of user experiences typically involve more than one service and are spread across multiple team and org boundaries.
Increasing the granularity of underlying user experiences, another key user experience at New Relic could be: _a customer can use a custom dashboard to visualize their telemetry data._
This SLO could look like:
| period | target | category | indicator |
| ------------ | ------ | ------------ | ------------------------------------------------- |
| last 28 days | 99.9% | availability | user interacts successfully with the dashboard UI |
As an example of taking the granularity too far, adding a chart widget in a dashboard is also a user experience. However, creating a specific SLO for this action doesn't provide additional value compared to the previous SLO about users successfully interacting with the dashboard UI.
In summary, use a top-down approach and start with the least granular service levels. Create more granular service levels only if necessary.
### The related entity [#sli-entity]
In the New Relic ecosystem, every service level is linked to another [entity](https://docs.newrelic.com/docs/new-relic-one/use-new-relic-one/core-concepts/what-entity-new-relic/), which is any element in your stack that reports data to us, or that generates data that we have access to. The entity that a service level is related to determines where the SLI/SLO results show.
You can define SLIs on any NRDB event or dimensional metric that is reported to New Relic. Most custom events are not related to a single New Relic entity, but provide higher level business and user experience insights. In this case, you can still relate the SLI to a specific entity or to a workload.
Keep in mind that the SLI queries will need to be under the scope of the same account where the related entity lives in.
### SLI queries [#sli-queries]
SLIs are defined as the percentage of good responses out of the total number of valid requests. Most often you’ll set up your SLIs by defining the valid and good pieces:
- A **valid request** is any request that you want to count as meaningful for your SLIs (for example, all transactions related to an endpoint that weren’t initiated by a health check).
- A **good response** is any response that you consider to provide a good output for the end-user or client service (for example, the service responded in less than 2 seconds, providing a good navigation experience for the end user).
Alternatively, you can define what you consider to be the bad responses instead:
- A **bad response** is any response that you consider to provide a bad output (for example, the service responded with a server error, causing the client to fail its flow). New Relic will automatically derive the count of good responses as `valid - bad`.
Request-based SLOs are based on an SLI defined as the ratio of the number of good requests to the total number of requests. A request-based SLO is met when that ratio meets or exceeds the target for the compliance period.
## Suggested SLIs [#suggested-sli]
In this section you’ll find some SLIs that are typically used to measure the performance of services and browser applications.
### SLIs for APM services and key transactions instrumented with the New Relic agent [#sli-apm]
Based on `Transaction` events, these SLIs are the most common for request-driven services:
**Service success**
Service success is the ratio of the number of successful responses to the number of all requests. This effectively is an error rate, but you can filter it down, for example removing expected errors.
**Valid events fields**
````sql
FROM Transaction
WHERE entityGuid = 'ENTITY_GUID'
```
Where `ENTITY_GUID` is the service's GUID.
**Bad events fields**
```sql
FROM TransactionError
WHERE entityGuid = 'ENTITY_GUID' AND error.expected != true
```
Where `ENTITY_GUID` is the service's GUID.
````
**Service latency**
A latency SLI measures the proportion of valid requests that were served faster than the threshold established as a good experience.
In order to determine that duration threshold, check how the service has been performing in the past weeks, and use that result as a realistic and achievable baseline. Afterwards, you can iterate on the SLI threshold, and align it with a more ambitious performance.
To select an appropriate value for the duration condition, one typical practice is to select the 95 percentile duration of the responses for the last 7 or 15 days. Find this duration threshold using the [query builder](https://docs.newrelic.com/docs/query-your-data/explore-query-data/query-builder/introduction-query-builder/), and use it to determine what you consider to be good events for your SLI:
````sql
SELECT percentile(duration, 95) FROM Transaction
WHERE entityGuid = 'ENTITY_GUID' SINCE 7 days ago LIMIT MAX
```
**Valid events fields**
```sql
FROM Transaction
WHERE entityGuid = 'ENTITY_GUID' AND transactionType = 'Web'
```
Where `ENTITY_GUID` is the service's GUID.
**Good events fields**
```sql
FROM Transaction
WHERE entityGuid = 'ENTITY_GUID' AND transactionType = 'Web' AND duration < DURATION
```
* Where `ENTITY_GUID` is the service's GUID.
* Where `DURATION` is the response time that you consider provides a good experience for your client service or end-user, in seconds.
````
### SLIs for APM services and key transactions instrumented with OpenTelemetry [#sli-otel]
Based on OpenTelemetry spans, these SLIs are the most common for request-driven services:
**Service success**
Service success is the ratio of the number of successful responses to the number of all requests. This effectively is an error rate, but you can filter it down, for example removing expected errors.
**Valid events fields**
````sql
FROM Span
WHERE entity.guid = 'ENTITY_GUID' AND (span.kind IN ('server', 'consumer')
OR kind IN ('server', 'consumer'))
```
Where `ENTITY_GUID` is the service's GUID.
**Bad events fields**
```sql
FROM Span
WHERE entity.guid = 'ENTITY_GUID' AND (span.kind IN ('server', 'consumer')
OR kind IN ('server', 'consumer')) AND otel.status_code = 'ERROR'
```
Where `ENTITY_GUID` is the service's GUID.
````
**Service latency**
A latency SLI measures the proportion of valid requests that were served faster than the threshold established as a good experience.
In order to determine that duration threshold, check how the service has been performing in the past weeks, and use that result as a realistic and achievable baseline. Afterwards, you can iterate on the SLI threshold, and align it with a more ambitious performance.
To select an appropriate value for the duration condition, one typical practice is to select the 95 percentile duration of the responses for the last 7 or 15 days. Find this duration threshold using the [query builder](https://docs.newrelic.com/docs/query-your-data/explore-query-data/query-builder/introduction-query-builder/), and use it to determine what you consider to be good events for your SLI:
````sql
SELECT percentile(duration.ms, 95) FROM Span
WHERE entityGuid = 'ENTITY_GUID' AND (span.kind IN ('server', 'consumer')
OR kind IN ('server', 'consumer')) SINCE 7 days ago LIMIT MAX
```
**Valid events fields**
```sql
FROM Span
WHERE entity.guid = 'ENTITY_GUID' AND (span.kind IN ('server', 'consumer')
OR kind IN ('server', 'consumer'))
```
Where `ENTITY_GUID` is the service's GUID.
**Good events fields**
```sql
FROM Span
WHERE entity.guid = 'ENTITY_GUID' AND (span.kind IN ('server', 'consumer')
OR kind IN ('server', 'consumer')) AND duration.ms < DURATION
```
* Where `ENTITY_GUID` is the service's GUID.
* Where `DURATION` is the response time that you consider provides a good experience for your client service or end-user, in seconds.
````
### SLIs for APM services using metric timeslice data [#sli-timeslices]
APM metrics are reported as [timeslice data](https://docs.newrelic.com/docs/data-apis/understand-data/new-relic-data-types/#timeslice-data). You can also leverage timeslice data for your SLIs.
Note: This feature is still in beta.
**Service success**
Service success is the ratio of the number of successful responses to the number of all requests. This effectively is an error rate.
**Valid data**
````sql
FROM Metric
SELECT getField(apm.service.transaction.duration, count)
WHERE appName = 'APP_NAME'
```
Where `APP_NAME` is the APM app name.
**Bad events fields**
```sql
FROM Metric
SELECT getField(apm.service.error.count, count)
WHERE appName = 'APP_NAME' AND getField(`apm.service.error.count`, count) > 0
```
Where `APP_NAME` is the APM app name.
````
**Service success - Using a custom metric name**
Imagine that good events are reported by a custom metric. Valid events counts could be the same.
**Valid data**
````sql
FROM Metric
SELECT getField(apm.service.transaction.duration, count)
WHERE appName = 'APP_NAME'
```
Where `APP_NAME` is the APM app name.
And, now we use the custom metric to discover the good events.
**Good data**
```sql
FROM Metric
SELECT getField(newrelic.timeslice.value, count)
WHERE appName = 'APP_NAME' AND metricTimesliceName = 'Custom/CrossClusterQuery/DataAvailability/status/success'
```
Where `APP_NAME` is the APM app name.
````
### SLIs for browser applications [#sli-browser]
The following SLIs are based on Google's Browser Core Web Vitals.
**Browser app success**
It's the proportion of page views that are served without errors.
**Valid events fields**
````sql
FROM PageView
WHERE entityGuid = 'ENTITY_GUID'
```
Where `ENTITY_GUID` is the browser app GUID.
**Bad events fields**
```sql
FROM JavaScriptError
WHERE entityGuid = 'ENTITY_GUID' AND firstErrorInSession IS true
```
Where `ENTITY_GUID` is the browser app GUID.
````
**Browser app largest contentful paint**
It’s the proportion of valid page views where the largest content element visible in the viewport was rendered faster than the threshold considered to correspond to a good experience.
**Valid events fields**
````sql
FROM PageViewTiming
WHERE entityGuid = 'ENTITY_GUID' AND largestContentfulPaint IS NOT NULL
```
Where `ENTITY_GUID` is the browser app GUID.
**Good events fields**
```sql
FROM PageViewTiming
WHERE entityGuid = 'ENTITY_GUID' AND largestContentfulPaint < 'LARGEST_CONTENTFUL_PAINT'
```
* Where `ENTITY_GUID` is the browser app GUID.
* Where `LARGEST_CONTENTFUL_PAINT` is the amount of time (in milliseconds) to render the largest content element visible in the viewport that you consider provides a good experience for your end user. A frequent standard is 4000 ms.
To determine a realistic number to use for `LARGEST_CONTENTFUL_PAINT` in your environment, one typical practice is to select the 95 percentile duration of the responses for the last 7 or 15 days. Find it by using the query builder:
```sql
SELECT percentile(largestContentfulPaint, 95) FROM PageViewTiming
WHERE entityGuid = 'ENTITY_GUID' SINCE 7 days ago LIMIT MAX
```
````
**Browser app interaction to next paint (INP)**
It’s the proportion of page views where the time between a user's first interacion with the page and the time when the browser responds to that interaction is less than a certain threshold.
**Valid events fields**
````sql
FROM PageViewTiming
WHERE entityGuid = 'ENTITY_GUID' AND interactionToNextPaint IS NOT NULL
```
Where `ENTITY_GUID` is the browser app GUID.
**Good events fields**
```sql
FROM PageViewTiming
WHERE entityGuid = 'ENTITY_GUID' AND interactionToNextPaint < INTERACTION_TO_NEXT_PAINT
```
* Where `ENTITY_GUID` is the browser app GUID.
* Where `INTERACTION_TO_NEXT_PAINT` is the amount of time (in milliseconds) the browser should respond in to provide a good experience for your end user. A frequent standard is 300 ms.
To determine a realistic number to use for `INTERACTION_TO_NEXT_PAINT` in your environment, one typical practice is to select the 95 percentile duration of the responses for the last 7 or 15 days. Find it by using the query builder:
```sql
SELECT percentile(interactionToNextPaint, 95) FROM PageViewTiming
WHERE entityGuid = 'ENTITY_GUID' SINCE 7 days ago LIMIT MAX FACET deviceType
```
````
**Browser app cumulative layout shift**
It’s the proportion of page views with a good cumulative layout shift (CLS). CLS is described as the total sum of all individual layout shift scores for every unexpected layout shift that occurs during the entire lifespan of the page. A layout shift occurs any time a visible element changes its position from one rendered frame to the next.
**Valid events fields**
````sql
FROM PageViewTiming
WHERE entityGuid = 'ENTITY_GUID' AND cumulativeLayoutShift IS NOT NULL
```
Where `ENTITY_GUID` is the browser app GUID.
If you’d like to create separate SLIs to track CLS in desktop and mobile devices separately, add one of these clauses at the end of the field:
* `AND deviceType = 'Mobile'`
* `AND deviceType = 'Desktop'`
**Good events fields**
```sql
FROM PageViewTiming
WHERE entityGuid = 'ENTITY_GUID' AND cumulativeLayoutShift < CUMULATIVE_LAYOUT_SHIFT
```
* Where `ENTITY_GUID` is the browser app GUID.
* Where `CUMULATIVE_LAYOUT_SHIFT` is a pre-set value. To provide a good user experience, your site should strive to have a CLS score of 0.1 or less. A CLS score of 0.25 or more is considered a poor user experience.
If you’ve decided to create separate SLIs to track CLS in desktop and mobile devices separately when you defined the valid events query, add this clause at the end of the field:
* `AND deviceType = 'Mobile'`
* `AND deviceType = 'Desktop'`
To determine a realistic number to select for `CUMULATIVE_LAYOUT_SHIFT` in your environment, one typical practice is to select the 75th percentile of page loads for the last 7 or 15 days, segmented across mobile and desktop devices. Find it by using the query builder:
```sql
SELECT percentile(cumulativeLayoutShift, 95) FROM PageViewTiming
WHERE entityGuid = 'ENTITY_GUID' SINCE 7 days ago LIMIT MAX FACET deviceType
```
````
### SLIs for synthetic checks [#sli-synthetic]
**Success**
Success is the ratio of the number of successful synthectic checks to the number of all checks.
**Valid events fields**
````sql
FROM SyntheticCheck
WHERE entity.guid = 'ENTITY_GUID'
```
Where `ENTITY_GUID` is the synthetic check's GUID.
**Good events fields**
```sql
FROM SyntheticCheck
WHERE entity.guid = 'ENTITY_GUID' AND result='SUCCESS'
```
Where `ENTITY_GUID` is the synthetic check's GUID.
````
## Create and edit service levels [#create-edit]
You can create SLIs and SLOs from several places on [in our UI](https://one.newrelic.com):
- Go to **[one.newrelic.com > All capabilities](https://one.newrelic.com/all-capabilities) > Service levels**. You can associate the SLI with any entity across your accounts, including workloads.
- From the **Service levels** page in any APM Service, key transactions, Browser application, or Synthetic monitor. The SLI will be associated with that specific entity. If you use this starting point, New Relic will automatically create the most common service level indicators for this entity type, based on the latest available data.
- From the **Service levels** tab in any workload. You can associate the SLI with any entity in the workload, or the whole workload.
Data doesn't appear right away after creating an SLI. Expect a few minutes delay before seeing the first SLI attainment results. The data has 13 month retention by default.
Remember that service levels can only be associated with a single account. For details on that, see [the requirements](#requirements).
To create service levels, follow these steps:
**Select the SLI data source**
In order to define your new SLI, choose one of these three options:
- **Entity data**: Base the SLI on standard data coming from our agents or your own custom events. This is the most common option. If this is your choice, select the entity (for example, APM service) you want to use.
- **Custom data**: Alternatively, you can base the SLI on your custom NRDB events or dimensional metrics. Use this option when you can't relate the service level data to a specific entity, or when you want to relate the service level directly to a workload.
- **Metric data**: Based on the data coming from Prometheus, OTel or your own custom dimensional metrics.
**Configure the queries**
In this step, you'll configure the SLI queries that determine which event is valid, or good, or bad.
If you associate the SLI with an APM service or a browser app, New Relic will suggest some typical SLI and their queries. We'll use the latest data as a baseline for your service level objectives, and you will be able to edit the SLI and SLO afterwards.
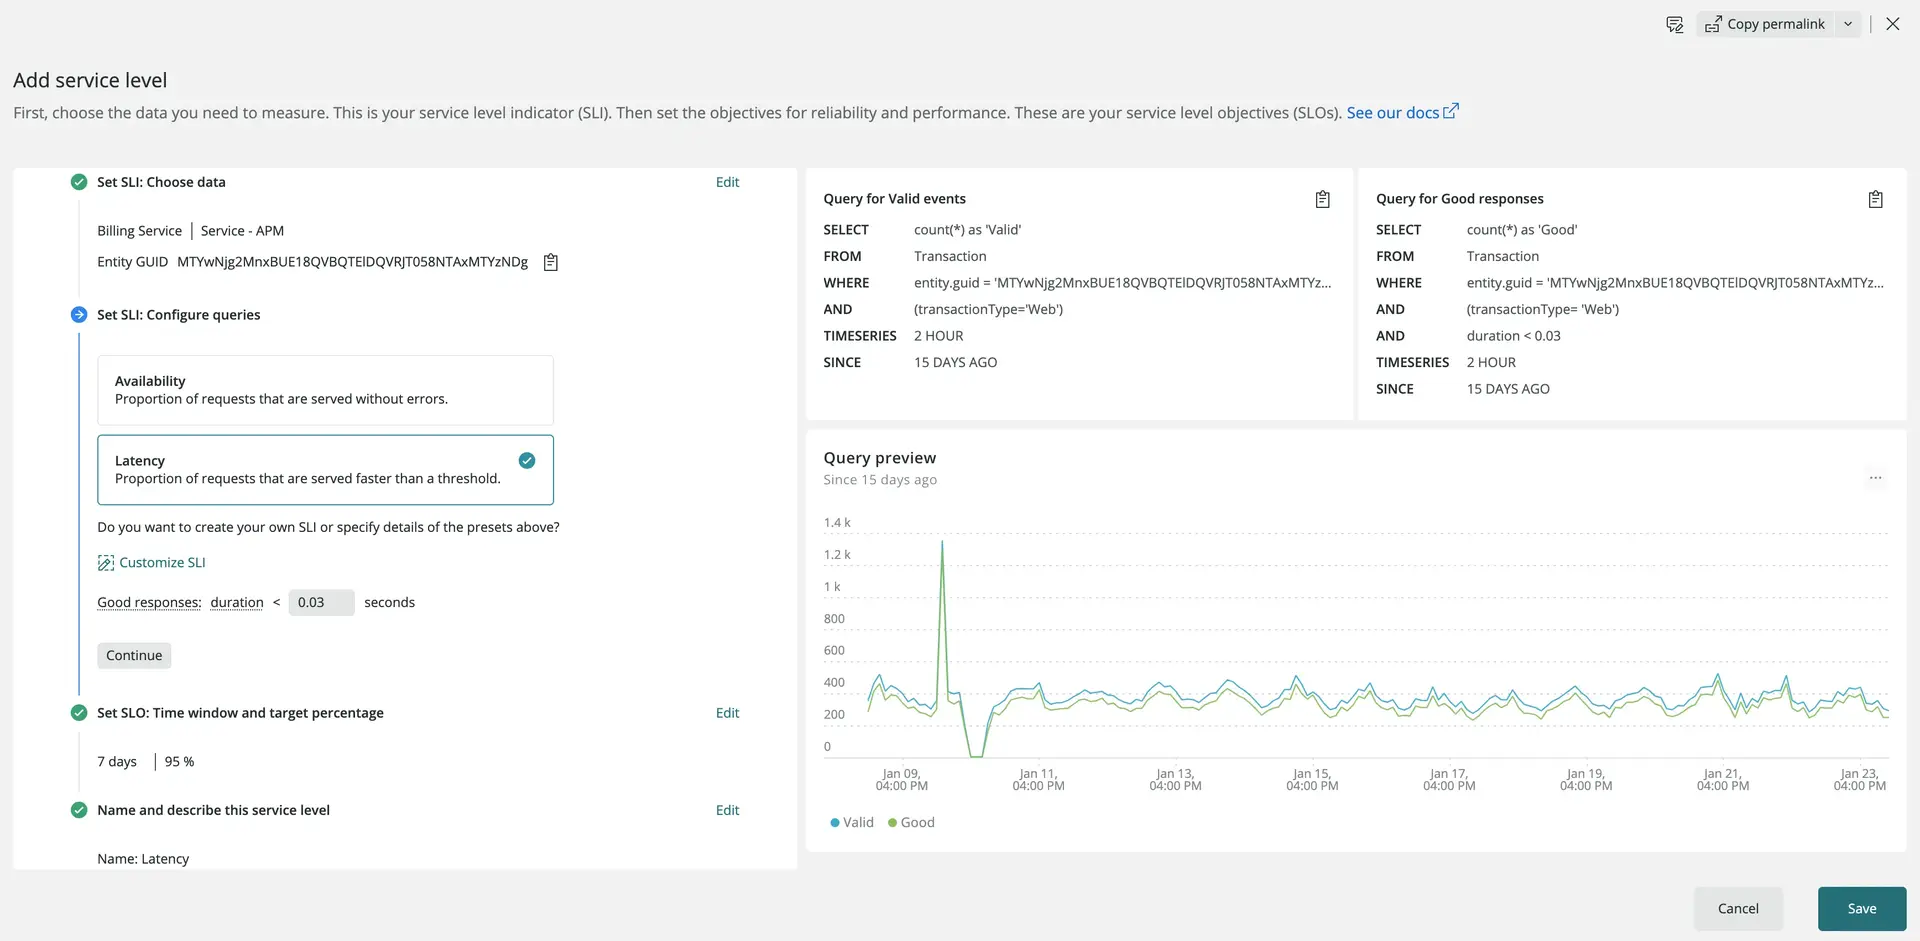
If you're using a different type of entity, you want to query dimensional metrics, or you want to customize the baseline values provided by New Relic, you can customize the SLI to your needs. For instance, you can use the `WHERE` clause to filter out health checks. You could also use different event types on each queries; in this case, make sure that each valid event corresponds only to one or less events on the good or bad query.
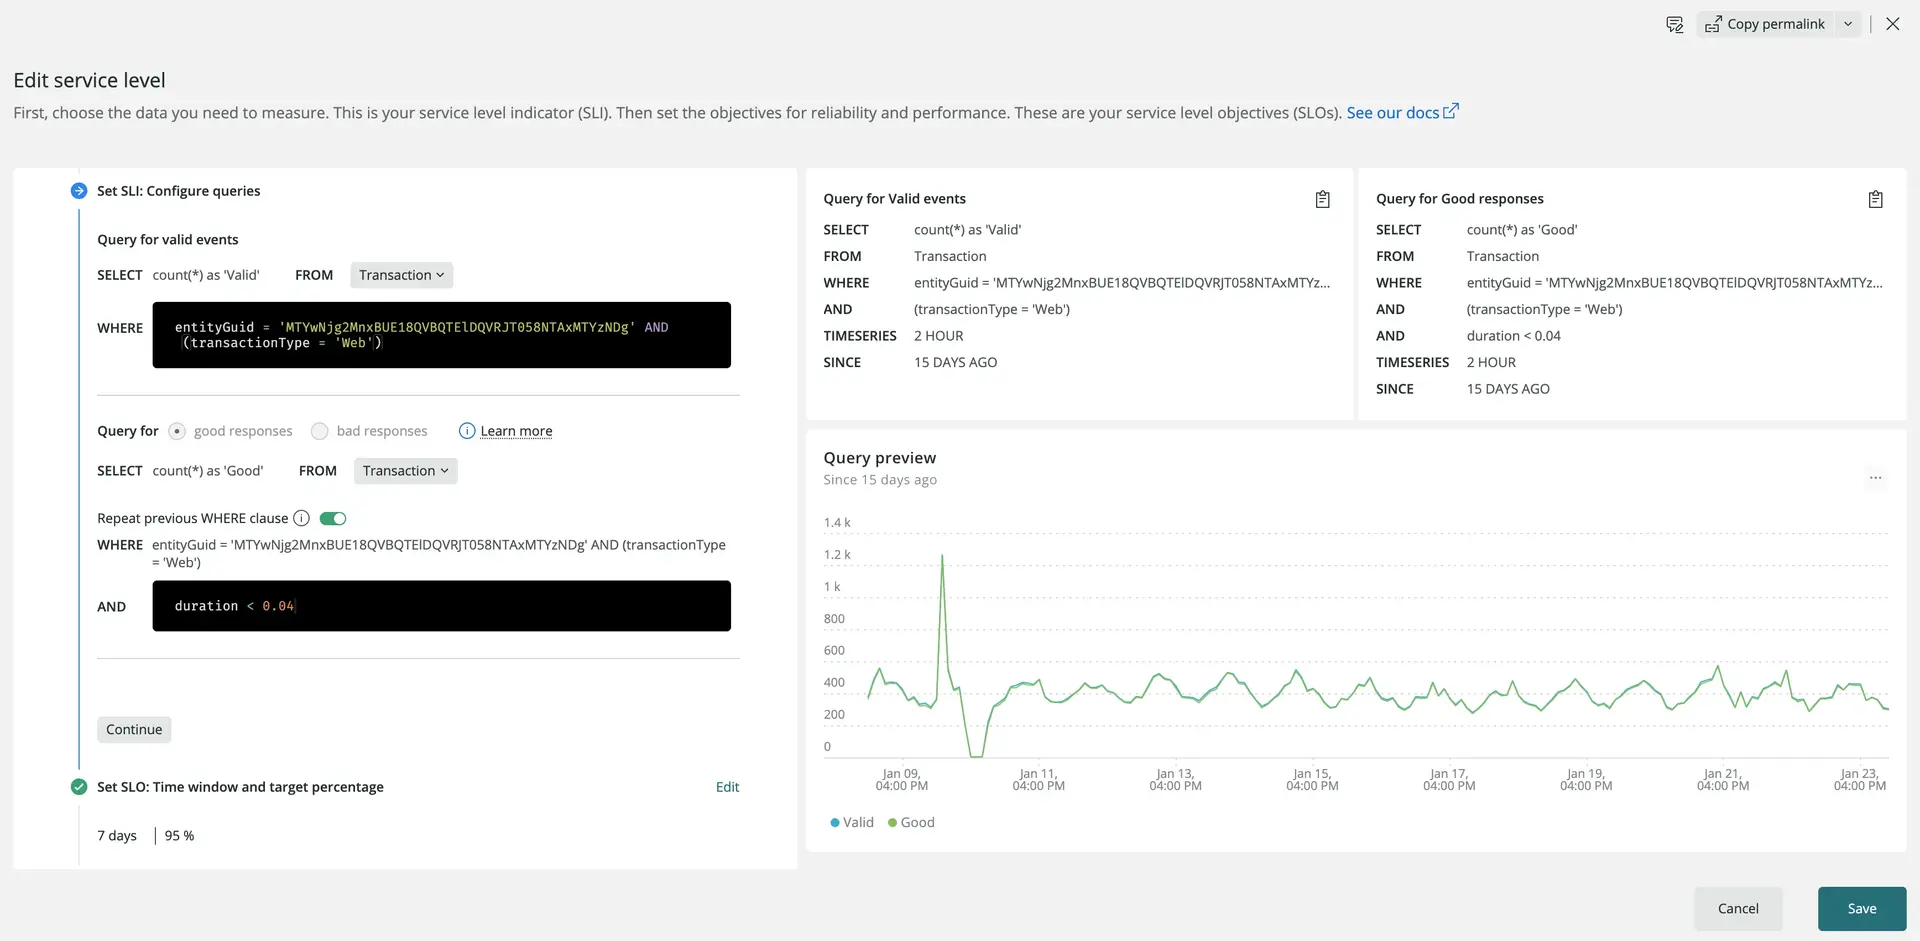
The account where the data is gathered from matches the account of the entity that the SLI refers to. Please see the section above to know what goes into each field.
On the right you'll see the final queries, and at the bottom you'll get a preview of the number of valid and good/bad events in the last days.
Here’s an example of the percentage-based success rate for a dimensional metric, let’s convert it into the valid/good events for SLI:
````sql
FROM Metric
SELECT percentage(sum(scrooge_do_expire_count),
WHERE status = 'success') AS 'Success Rate'
WHERE env = 'production'
AND status != 'attempt'
```
For the valid queries we would just copy the outside `WHERE` clause:
```sql
FROM Metric
SELECT sum(scrooge_do_expire_count)
WHERE env = 'production'
AND status != 'attempt'
```
While the good event would be the outside `WHERE` clause and `WHERE` clause from the percentage function:
```sql
FROM Metric
SELECT sum(scrooge_do_expire_count)
WHERE env = 'production'
AND status != 'attempt'
AND status = 'success'
```
The four aggregation functions that we currently support are `count()`, `sum()`, `getField()` and `getCdfCount()`. `Count` and `sum` are available for all event types, while `getField` and `getCdfCount` are only available when selecting from **Metric**.
Use the `count()` function with event data to count the number of valid/good/bad events.
The `sum()` function is helpful if you have pre-aggregated counters in event data or dimensional metrics. It requires a parameter: the attribute to use in the sum.
Use the `getField()` and `getCdfCount()` functions to see how often a distribution metric attribute is below or at a threshold. Both functions require an attribute, and getCdfCount() also requires a threshold to measure value against.
Example using `count()`:
```sql
FROM JavaScriptError
SELECT count(*)
WHERE entityGuid = 'ENTITY_GUID' AND firstErrorInSession IS true
```
Example using `sum()`:
```sql
FROM ServerlessSample
SELECT sum(provider.errors.Sum)
WHERE awsAccountId = 'XXX' AND provider LIKE 'LambdaFunction%'
```
Example using `getField()` combined with `getCdfCount()`:
```sql
FROM Metric
SELECT getField(`newrelic.goldenmetrics.synth.monitor.medianDurationS`, count) AS 'Valid'
FROM Metric
SELECT getCdfCount(`newrelic.goldenmetrics.synth.monitor.medianDurationS`, 0.5) AS 'Good'
```
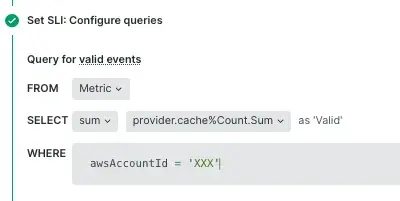
You can also use wildcards in your SLI queries, here's an example:
```sql
FROM ApiGatewaySample
SELECT sum(provider.cache%Count.Sum)
WHERE awsAccountId = 'XXX'
```
 When writing your SLI queries, you can add [comments](https://docs.newrelic.com/docs/nrql/nrql-syntax-clauses-functions/#comments) to help your team members better understand the query.
````
**Set the SLO time window and target**
In this step you'll get a preview of the SLI value, and you'll add one SLO for this SLI: Just select the length of the time window and the percentage target. The chart on the right will help you anticipate whether the target you're setting is feasible or if it's often missed.
Rolling time-window SLOs are supported. With a rolling time-window, the SLO compliance takes into account the last N days. Every minute, the oldest data drops out of the current calculation and new data replaces it.
**Name and tag your SLI**
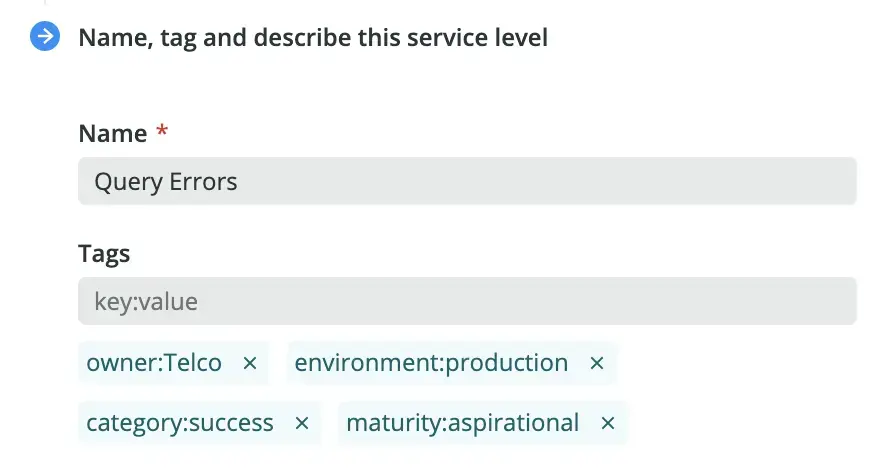
Select a short name for your SLI which helps you recognize what it's measuring.
We recommend that you add tags to your SLI, so you can later use them for searching, filtering, and grouping SLIs on the UI.
You can set any tag that's meaningful to your organization. A dropdown will suggest useful tag keys such as the following:
- `owner`: The team or business unit that owns this service level, and will react when the SLO target is missed.
- `category`: A keyword that describes what the SLI is measuring, such as `latency`. If you follow the suggested service level flow, New Relic will populate this tag for you, and you may later edit it.
- `environment`: The environment that the service level is measuring, and that makes sense to your use case.
- `maturity`: Useful to communicate to your stakeholders how stable the SLO is. We recommend that you use tag values such as `test`, `commitment`, or `aspirational`.
- `user_journey` and `application`: These kinds of tags help you group the SLIs that apply to the same user experience, whether it's a whole user journey, or just a specific application.
Additionally, the dropdown also displays the related entity tags, so you can quickly add them to the SLI as well.
To finish, you may optionally add a description for that service level.
### Edit SLIs [#edit-sli]
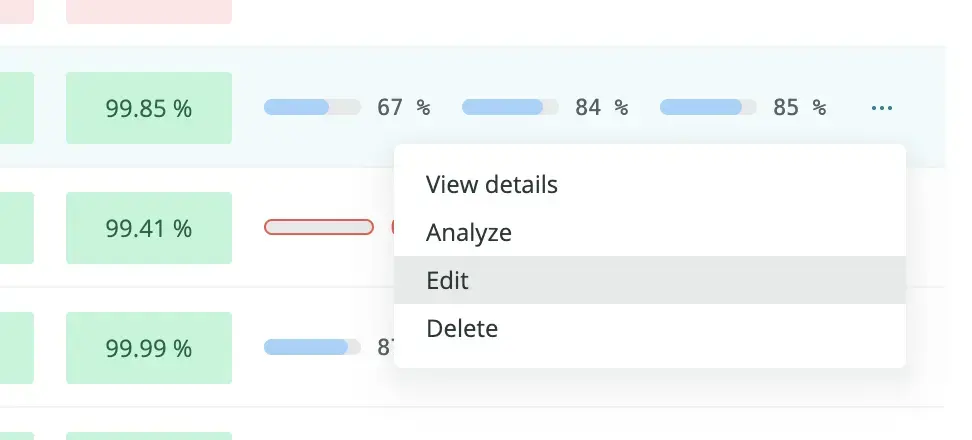
Once you've created an SLI, you can edit it through the service levels list page, by clicking on the **...** menu and then `Edit`, as shown here:
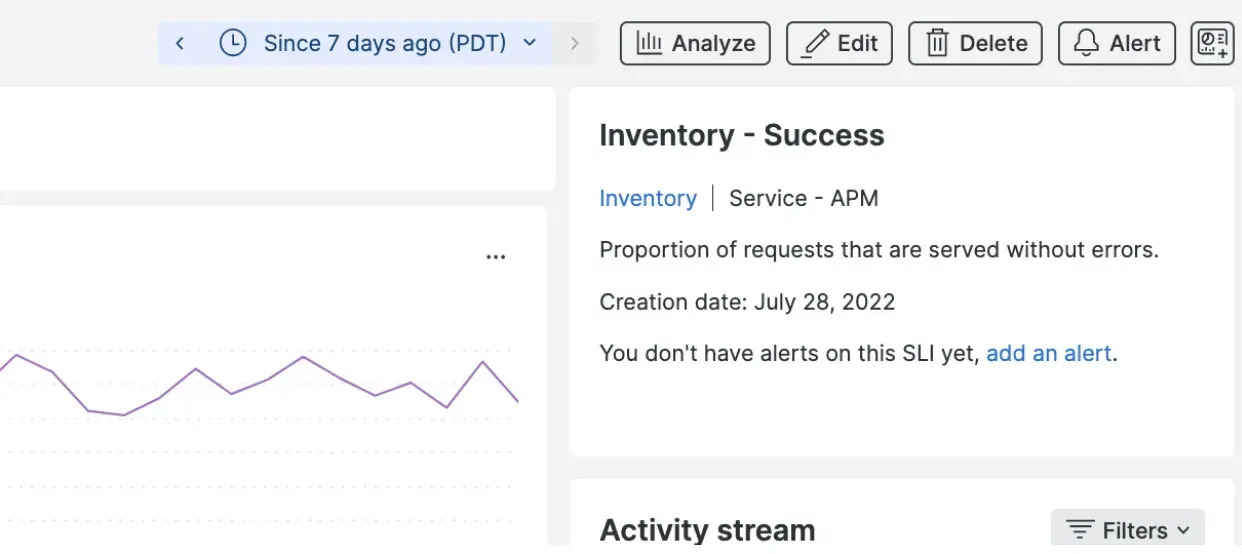
or you can do that same thing through the summary page, by clicking `Edit`:
## Optimize your SLM [#optimize]
For information on how to optimize your SLM implementation, see our [Observability maturity SLM guide](https://docs.newrelic.com/docs/new-relic-solutions/observability-maturity/uptime-performance-reliability/optimize-slm-guide).
When writing your SLI queries, you can add [comments](https://docs.newrelic.com/docs/nrql/nrql-syntax-clauses-functions/#comments) to help your team members better understand the query.
````
**Set the SLO time window and target**
In this step you'll get a preview of the SLI value, and you'll add one SLO for this SLI: Just select the length of the time window and the percentage target. The chart on the right will help you anticipate whether the target you're setting is feasible or if it's often missed.
Rolling time-window SLOs are supported. With a rolling time-window, the SLO compliance takes into account the last N days. Every minute, the oldest data drops out of the current calculation and new data replaces it.
**Name and tag your SLI**
Select a short name for your SLI which helps you recognize what it's measuring.
We recommend that you add tags to your SLI, so you can later use them for searching, filtering, and grouping SLIs on the UI.
You can set any tag that's meaningful to your organization. A dropdown will suggest useful tag keys such as the following:
- `owner`: The team or business unit that owns this service level, and will react when the SLO target is missed.
- `category`: A keyword that describes what the SLI is measuring, such as `latency`. If you follow the suggested service level flow, New Relic will populate this tag for you, and you may later edit it.
- `environment`: The environment that the service level is measuring, and that makes sense to your use case.
- `maturity`: Useful to communicate to your stakeholders how stable the SLO is. We recommend that you use tag values such as `test`, `commitment`, or `aspirational`.
- `user_journey` and `application`: These kinds of tags help you group the SLIs that apply to the same user experience, whether it's a whole user journey, or just a specific application.
Additionally, the dropdown also displays the related entity tags, so you can quickly add them to the SLI as well.

To finish, you may optionally add a description for that service level.
### Edit SLIs [#edit-sli]
Once you've created an SLI, you can edit it through the service levels list page, by clicking on the **...** menu and then `Edit`, as shown here:

or you can do that same thing through the summary page, by clicking `Edit`:

## Optimize your SLM [#optimize]
For information on how to optimize your SLM implementation, see our [Observability maturity SLM guide](https://docs.newrelic.com/docs/new-relic-solutions/observability-maturity/uptime-performance-reliability/optimize-slm-guide).