---
title: Send Snyk data to New Relic
source: https://docs.newrelic.com/docs/vulnerability-management/getting-started/integrations/snyk
---
This guide describes how to integrate New Relic Security RX with Snyk Webhooks. Webhooks in Snyk are a beta feature only available for Snyk's Business or Enterprise customers. As a beta feature, the Webhook API and structure may change without notice, so please exercise discretion when using Webhooks for automation in your security processes.
While we will make every effort to keep in sync with changes to Snyk Webhooks, if you notice that we've fallen out of step, let us know.
After completion of these steps, you will see new vulnerabilities detected by Snyk in your New Relic account in real time, and you'll be able to build out analytics dashboards newly detected issues.
For more information, see the [official Snyk documentation](https://snyk.docs.apiary.io/#reference/webhooks).
## Prerequisites [#prereqs]
- A Snyk API Token
- New Relic license key
- You must be a Snyk organization administrator to configure Webhooks via API
## Webhook configuration [#webhook-config]
To configure your webhook, go through the following steps:
### Get your Snyk API token[#snky-API-token]
In the Snyk UI, under the user menu, click **Account settings** and copy your Snyk API Token key. Read more in the [official Snyk documentation](https://docs.snyk.io/snyk-admin/snyk-broker/snyk-broker-code-agent/setting-up-the-code-agent-broker-client-deployment/step-1-obtaining-the-required-tokens-for-the-setup-procedure/obtaining-your-snyk-api-token).
### New Relic **License - Insert** license key[#nr-license-key]
Select a **License - Insert** license key in your New Relic account, or create a new one.
> #### ⚠️ IMPORTANT
>
> In addition to your Snyk and New Relic keys, you need to generate a random signing secret. This is required by Snyk but not used by New Relic when receiving data.
### Compile Snyk organization IDs[#sny-org-ids]
Get a list of the Snyk organization IDs you have access to by running the following command:
````shell
curl -H "content-type: application/json" \
-H "authorization: token YOUR_SNYK_API_TOKEN" \
"https://api.snyk.io/api/v1/orgs" | jq -r '.orgs[] | "\(.id)\t\(.name)"'
```
To run this command, you need to install [jq](https://stedolan.github.io/jq/), a command-line JSON processor.
````
### Create a webhook in each Snyk organization [#create-webhook]
You must configure a webhook separately for each Snyk organization.
Run the following command to create a webhook that will post to the security ingest processor at New Relic every time a project is tested. This gets sent through the [project_snapshot](https://snyk.docs.apiary.io/#introduction/consuming-webhooks/event-types) event type.
````shell
curl -X POST -H "content-type: application/json" \
-H "authorization: token " \
--data '{"url":
"https://security-ingest-processor.service.newrelic.com/v1/security/webhooks/snyk?Api-Key=YOUR_NEW_RELIC_LICENSE_KEY",
"secret": "YOUR_SIGNING_SECRET"}' \
"https://api.snyk.io/api/v1/org//webhooks"
```
Use the appropriate endpoint based on your region:
- EU: `https://security-ingest-processor.service.eu.newrelic.com/v1/security/webhooks`
- JP: `https://security-ingest-processor.service.jp.newrelic.com/v1/security/webhooks`
````
### Test a webhook connection [#confirm-webhook]
The following command returns an array of results with a webhook ID and url for each configured webhook in the organization:
````shell
curl -H "content-type: application/json" \
-H "authorization: token YOUR_SNYK_API_TOKEN" \
"https://api.snyk.io/api/v1/org/YOUR_SNYK_ORG_ID/webhooks"
```
To test a webhook, copy the ID from the webhook you want to test, and run the following command:
```shell
curl -X POST --data "" -H "content-type: application/json" \
-H "authorization: token YOUR_SNYK_API_TOKEN" \
"https://api.snyk.io/api/v1/org/YOUR_SNYK_ORG_ID/webhooks/YOUR_WEBHOOK_ID/ping"
```
The command will return `OK` if you've set up the webhook correctly.
````
## Test a Webhook manually [#webhook-test]
You might need to trigger a manual scan of a project within Snyk to get data flowing into New Relic. You can do this through the Snyk CLI or API, or from the Snyk UI, by clicking **Retest now** on a scan target within a project.
Check the official Snyk documentation on [running manual tests](https://docs.snyk.io/getting-started/running-tests#run-tests-manually).

Click **Retest now** on a scan target within a project.
## Verify that your Snyk data is sent to New Relic [#verify-snyk-sending]
Check logs in New Relic to verify that the Snyk findings from your manual test were successfully delivered by entering `logtype:security` to filter for security events.
1. Go to **[one.newrelic.com](https://one.newrelic.com) > All capabilities > Logs**.
2. In the search bar, enter `logtype:security` and click **Query logs**.

**[one.newrelic.com](https://one.newrelic.com) > All capabilities > Logs**
The Snyk Webhook transports only return **New Issues** and **Removed Issues** that occur with each test. New Relic will parse only the **New Issues**. If the manual test doesn't reveal any new issues, you won't see any new security logs in New Relic. In this case, you'll see a log message in New Relic for the successful webhook transport along the lines of:
```sql
SnykWebhook scan reported 879 byte payload with 0 events (0 unique issue ids) from '' errors=no
```
## View Snyk data in New Relic [#view-data-NR]
Once you have one or more webhook events configured, you can view the results of Snyk webhook being sent to our security ingest endpoint in New Relic.
Check out the 3 ways you can use to identify Snyk data in New Relic:
### Viewing data in Security RX [#view-data]
You can find this page at **[one.newrelic.com](https://one.newrelic.com) > All capabilities > Security RX**.
This view gives you a birds-eye view of all your software's vulnerabilities, including any data that's been consumed from the Snyk integration. Use the various tabs to identify and triage vulnerabilities.
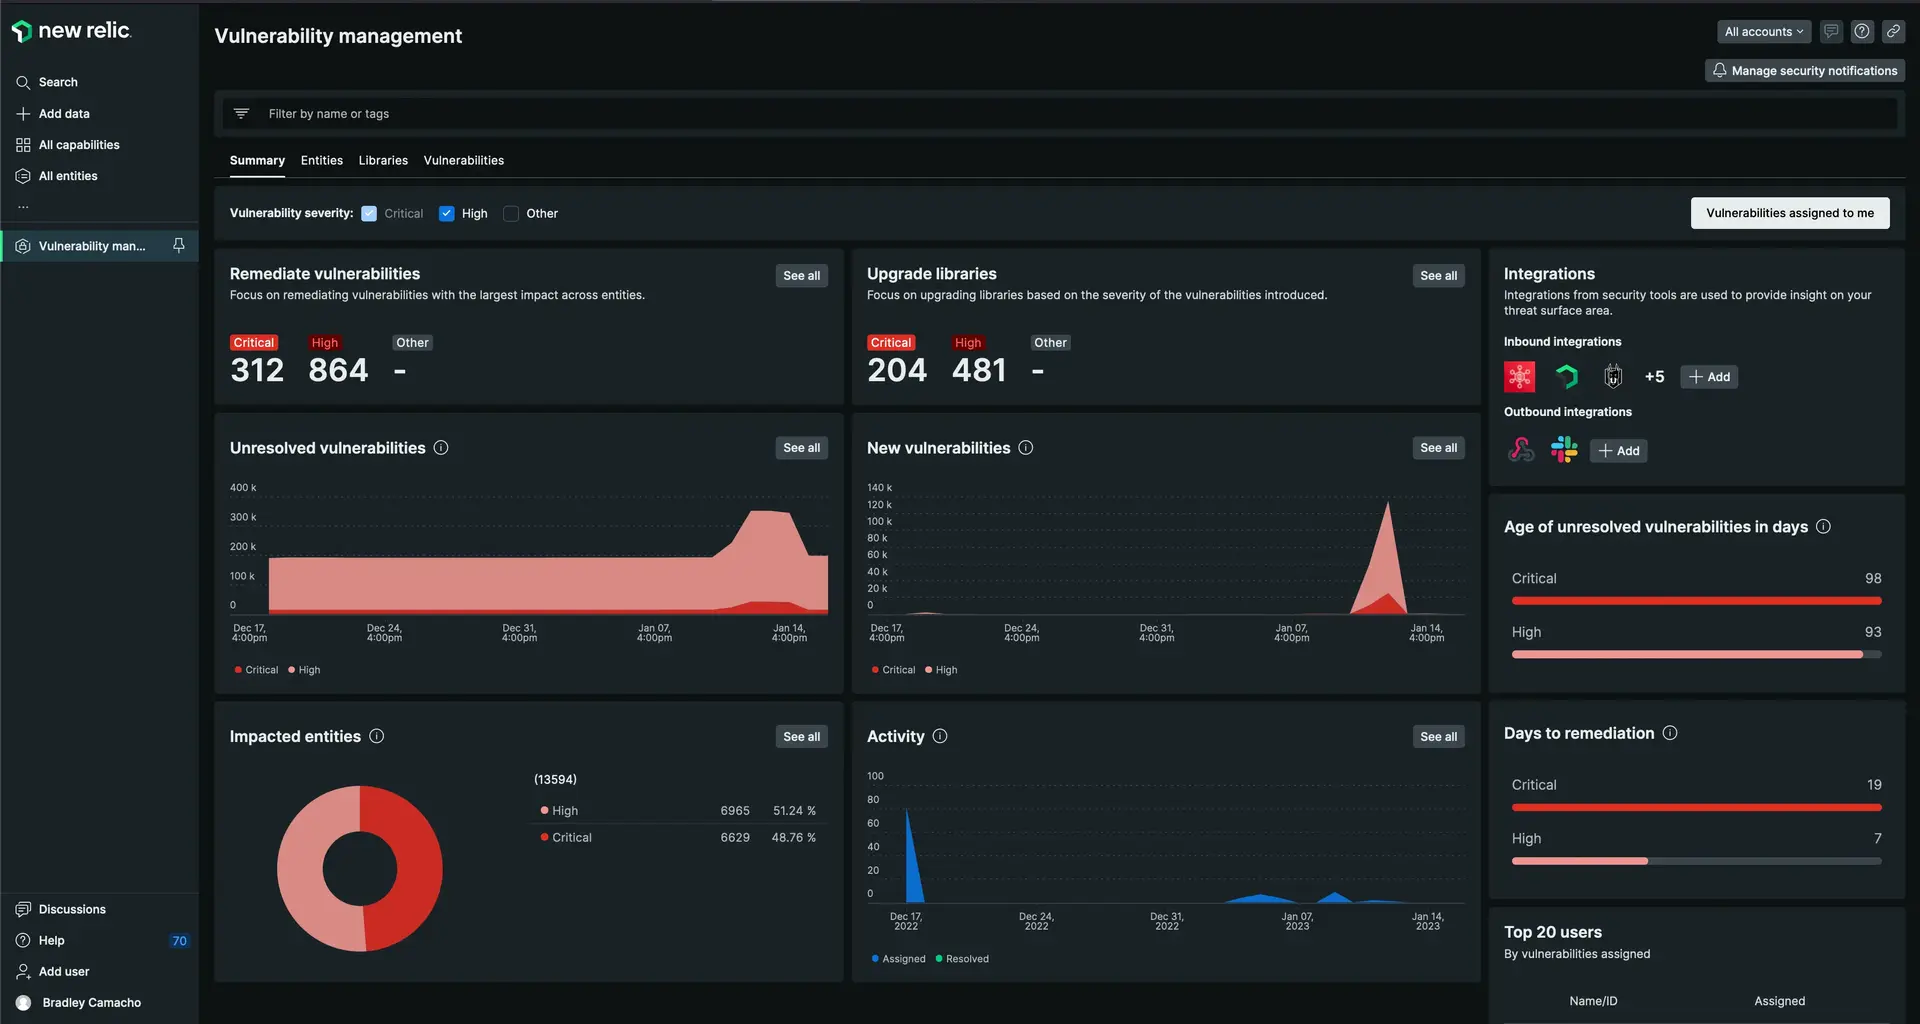
**[one.newrelic.com](https://one.newrelic.com) > All capabilities > Security RX**.
### Querying vulnerability events [#query-vuln-events]
When Snyk events are processed, they're stored in the **Vulnerability** table. To query this table and view the raw data, do the following:
1. Go to **[one.newrelic.com](https://one.newrelic.com) > All capabilities > Query your data**.
2. Enter the following query:
```sql
FROM Vulnerability SELECT * WHERE source = 'Snyk' SINCE 7 days ago
```

**[one.newrelic.com](https://one.newrelic.com) > All capabilities > Query your data**
### Snyk dashboard [#snyk-dashboard]
You can install the pre-built Snyk dashboard from the [New Relic Instant Observability marketplace](https://newrelic.com/instant-observability/snyk).
This dashboard offers another view into vulnerability data, and you can use the chart widgets to build your own dashboard views from your Snyk integration data.

Install the [Instant Observability Snyk dashboard](https://newrelic.com/instant-observability/snyk).