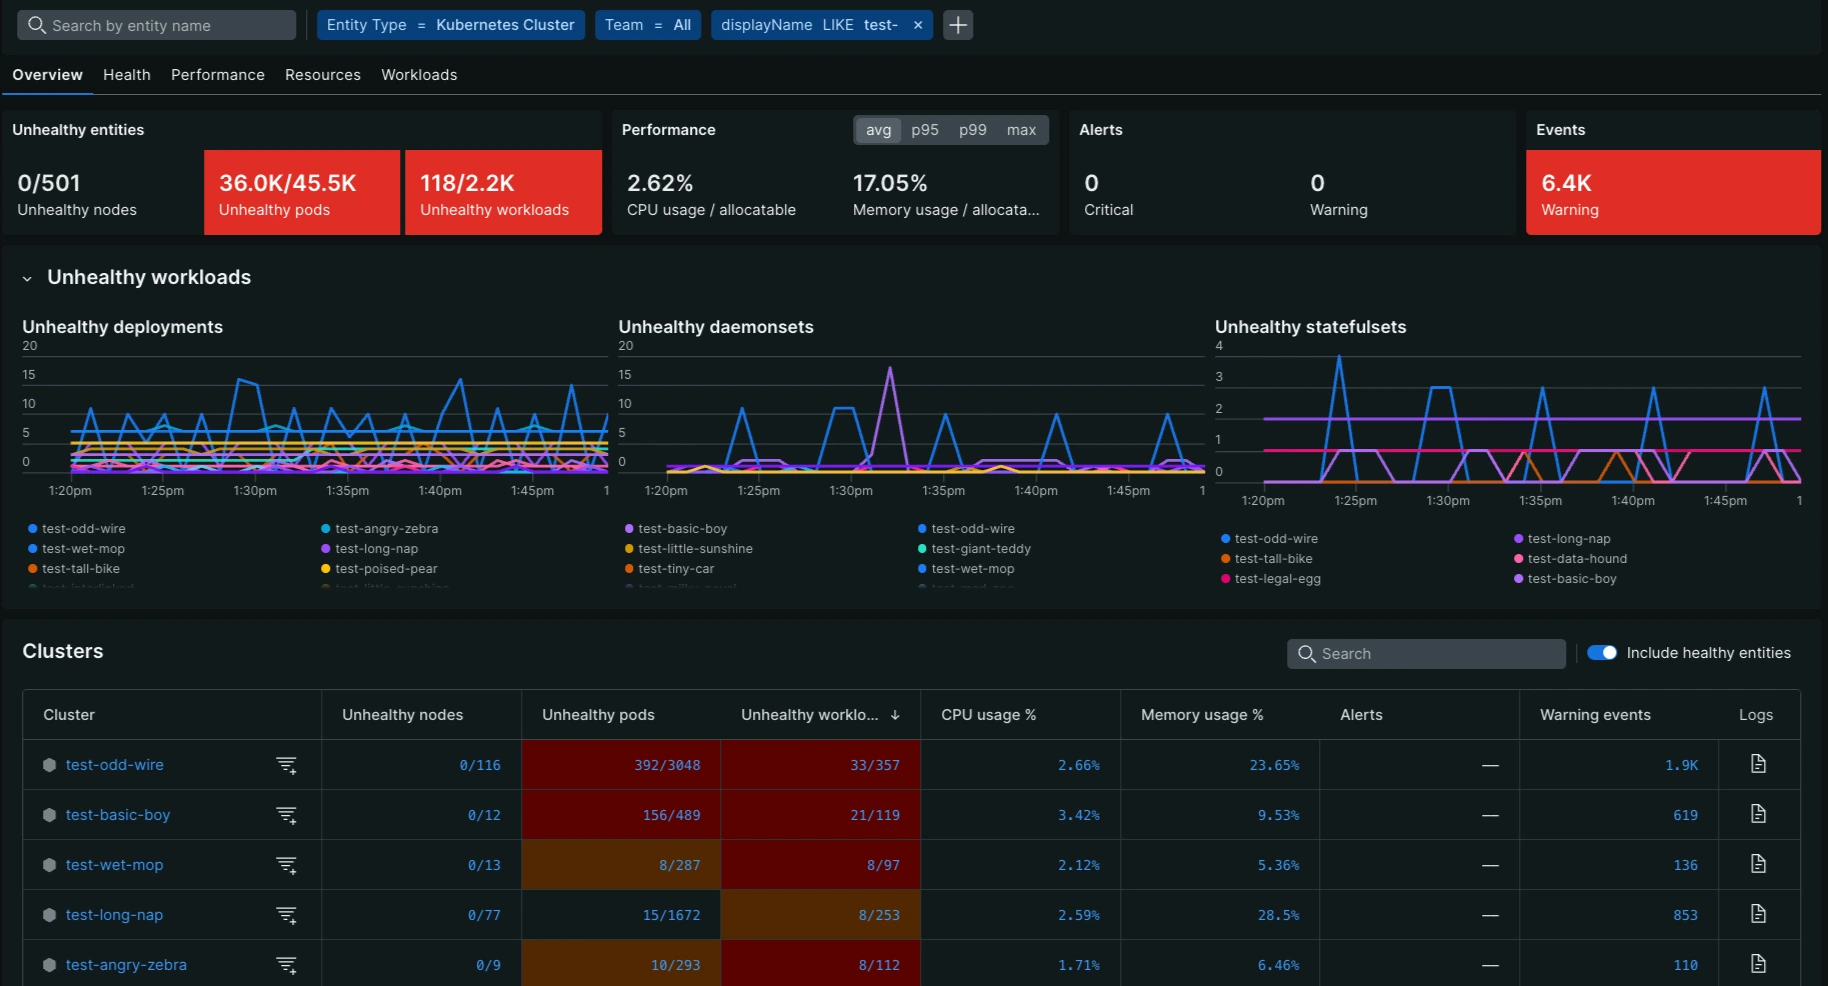
Modern Kubernetes environments have evolved into complex, multi-cluster fleets, but traditional observability tools often provide only a fractured, siloed view of individual clusters. Kubernetes monitoring in New Relic opens on a fleet-wide view that turns that complexity into clarity.
This unified view helps platform engineers and SREs to:
Unify fleet-wide observability on a single dashboard that's compatible with clusters monitored by New Relic agents or OpenTelemetry.
Accelerate root cause analysis with a guided triage workflow.
Reduce costs by identifying wasted resources across the entire fleet.
Empower developers with an application-centric view for self-service.
Access the UI
This is the default Kubernetes experience in New Relic. To open it:
The UI is structured to provide both a high-level overview and deep-dive capabilities into your entire Kubernetes fleet.
The main components include:
Entity filters: Filter and triage issues using tags and values at the cluster or node level.
Cluster filter: Filter to isolate the UI to a single or smaller set of Kubernetes clusters.
Colored scorecards: Display relevant high-level metrics to surface the most important issues that need attention across the entire fleet.
Click a scorecard to order the table in the context of that metric, surfacing the clusters and nodes with the most critical issues at the top.
It also enables a line chart to visualize the metric's evolution over the selected time range.
Select avg, p95, p99, or max to update the scorecards and line chart. The breakdown table always displays average values.
Line chart: Provides the evolution of the metric over the selected time frame for trend analysis.
Table: Lists all entities in the fleet and provides detailed metric data for each cluster under the five main tabs.
Health focus: The table provides a filter to only list "unhealthy" entities to focus your attention where it is really needed.
Search: A text search bar allows you to filter table rows based on free text entered.
Color-coding: Like the scorecards, table cells are color-coded (Yellow, Red) to quickly draw attention to entities with issues that meet a specific severity threshold.
Column chooser: The Workloads tab ships a lean default column set and lets you add or remove columns. Your column selection persists across sessions.
Workload type selector: Narrow the Workloads tab to a specific workload type, such as Deployments, DaemonSets, or StatefulSets.
Feedback button: Lets you easily share feedback on your experience with the UI.
Multi-account fleet visibility
Clusters from the New Relic accounts you have access to appear together in the same fleet view, so monitoring a fleet that spans multiple accounts doesn't require switching account context.
To see clusters from more than one account:
In the account picker, select All accounts.
Use the account filter in the entity filter bar to narrow the view to the specific accounts you need.
Entity popovers
Selecting an entity in the table opens a popover that gives you context on that entity without leaving the fleet view:
Golden metrics, a snapshot of the entity's key performance metrics.
Related entities, grouped and sorted by type, which you can open in a stacked view alongside your current context.
Links to related applications, marked with an external link icon where they open the APM experience rather than a stacked view.
Object description, which opens the manifest for the selected Kubernetes object.
Team, if one is set for the entity.
Dashboard, a link to the entity's corresponding dashboard.
Correlate with APM, events, logs, and alerts
The fleet view is designed so you don't have to abandon it to correlate signals and reduce MTTR:
APM insights: The Workloads view surfaces application performance data for the applications running in a workload, so you can move between infrastructure health and application performance in one place.
Alerts: Open alerts are surfaced against clusters, nodes, and workloads, including alert indicators in the Workloads tab, and open in a stacked view for immediate context. Open alerts appear regardless of the time range you have selected, so an active alert is never hidden by a narrow time picker.
Events and logs: Kubernetes events and logs for an entity open in a stacked view alongside your current context, so you can correlate signals without losing your place in the triage flow.
Tab-specific metrics
The UI is organized into five main tabs.
Scorecard: thresholds apply to the scorecards and Table: thresholds apply to table rows.
When they're the same, only one set is listed. Counts cover the selected time range.
The Overview tab provides a general summary of the operational health, capacity, and risk across your entire Kubernetes fleet.
Metric name
Description
Importance
Thresholds
Unhealthy nodes
Unhealthy nodes out of all nodes. A node is unhealthy if it isn't ready or reports a pressure or network condition.
Signals widespread instability and potential zone failures across the infrastructure.
Orange: 1% to < 5% of nodes; Red: ≥ 5%.
Unhealthy workloads
Deployments, daemonsets, and statefulsets with missing or unavailable pods, out of all workloads.
Indicates failure to reconcile desired states across the organization.
Orange: 1% to < 5% of workloads; Red: ≥ 5%.
Running pods
Percentage of pods in the Running phase, excluding job pods and completed pods.
Operational success rate; less than 90% running pods indicates widespread failure.
Scorecard: Orange: 90% to < 95%; Red: < 90%. Table: Orange: > 95% to 99%; Red: ≤ 95%.
CPU usage
Node CPU usage as a percentage of allocatable CPU.
Measures aggregate node saturation risk across the entire estate.
Orange: 75% to < 95%; Red: ≥ 95%.
Memory usage
Node memory usage as a percentage of allocatable memory.
High values indicate risk of aggregate eviction storms across clusters.
Orange: 75% to < 95%; Red: ≥ 95%.
Ephemeral storage
Percentage of node filesystem capacity used.
Critical to prevent Kubelet crashes.
Orange: 75% to < 95%; Red: ≥ 95%.
Persistent storage
Percentage of pod volume capacity used.
Critical to prevent stateful application crashes and data write failures.
Orange: 75% to < 95%; Red: ≥ 95%.
Warning events
Number of Kubernetes Warning events.
High noise levels obscure critical alerts and indicate config debt.
Orange: 1 to 49; Red: ≥ 50.
The Health tab focuses on metrics related to the availability and current status of your nodes and pods to detect immediate failure risks.
Metric name
Description
Importance
Thresholds
Nodes ready
Nodes that reported no unhealthy condition, out of all nodes.
Availability metric; values below 95% signal severe fleet instability.
Scorecard: Orange: 95% to < 100%; Red: < 95%. Table: Cluster rows: Orange: > 1% to 2% of nodes ready; Red: ≤ 1%. Node rows: Red: FALSE.
Symptom of hardware failure or systemic CNI issues.
Scorecard: Orange: 11 to < 50 per 100 nodes; Red: ≥ 50 per 100 nodes. Table: Orange: 5 to 10; Red: ≥ 11.
Warning events
Number of Kubernetes Warning events.
High noise levels obscure critical alerts and indicate config debt.
Orange: 1 to 49; Red: ≥ 50.
The Performance tab measures utilization against total capacity and limits to identify node saturation and risk of performance degradation.
Metric name
Description
Importance
Thresholds
CPU usage (total)
Node CPU usage as a percentage of allocatable CPU.
Measures saturation risk across the entire estate.
Orange: 75% to < 95%; Red: ≥ 95%.
CPU usage (limits)
CPU usage as a percentage of CPU limits, where set.
Measures proximity to throttling.
Orange: 75% to < 95%; Red: ≥ 95%.
Memory usage (total)
Node memory usage as a percentage of allocatable memory.
Proximity to eviction thresholds.
Orange: 75% to < 95%; Red: ≥ 95%.
Memory usage (limits)
Memory working set as a percentage of memory limits, where set.
Proximity to OOMKill events.
Orange: 75% to < 95%; Red: ≥ 95%.
Ephemeral storage
Percentage of node filesystem capacity used.
Critical to prevent Kubelet crashes.
Orange: 75% to < 95%; Red: ≥ 95%.
Pod capacity
Running pods as a percentage of the maximum pods that nodes can run.
Measures resource density and slot exhaustion.
Orange: 85% to < 100%; Red: ≥ 100%.
Warning events
Number of Kubernetes Warning events.
High noise levels obscure critical alerts and indicate config debt.
Orange: 1 to 49; Red: ≥ 50.
The Resources tab analyzes Request vs. Usage and Request vs. Limits to assess resource allocation efficiency and identify waste or sizing inaccuracies.
Metric name
Description
Importance
Thresholds
CPU usage vs requests
CPU usage as a percentage of CPU requests.
Governance metric for sizing accuracy and waste.
Scorecard: Orange: < 70% or ≥ 200%. Table: Orange: < 70% or > 200%.
CPU requests vs limits
CPU requests as a percentage of CPU limits.
Measures performance headroom and burst capacity.
Orange: 75% to < 95%; Red: ≥ 95%.
CPU throttling
Percentage of CPU periods in which containers were throttled.
Measures latency/lag caused by CFS quotas.
Orange: 10% to < 50%; Red: ≥ 50%.
Memory usage vs requests
Memory usage as a percentage of memory requests.
Governance metric for memory sizing accuracy.
Scorecard: Orange: < 70% or ≥ 200%. Table: Orange: < 70% or > 200%.
Memory requests vs limits
Memory requests as a percentage of memory limits.
Helps to assess resource allocation efficiency and potential overprovisioning.
High noise levels obscure critical alerts and indicate config debt.
Orange: 1 to 49; Red: ≥ 50.
The Workloads tab provides an application-centric view of your deployments, daemonsets, and statefulsets, focusing on metrics such as readiness, restarts, and missing replicas to diagnose application instability and poor QoS.
Warning events are available in this tab for Deployments, DaemonSets, and StatefulSets, so you can see the events behind an unhealthy workload without leaving the tab.
Metric name
Description
Importance
Thresholds
CPU usage (requests)
CPU usage as a percentage of CPU requests.
Measures how close the workload is to exceeding its requested CPU.
Orange: 75% to < 95%; Red: ≥ 95%.
CPU throttling
Percentage of CPU periods in which containers were throttled.
Measures latency/lag caused by CFS quotas.
Orange: 10% to < 50%; Red: ≥ 50%.
Memory usage (limits)
Memory working set as a percentage of memory limits, where set.
Proximity to OOMKill.
Orange: 75% to < 95%; Red: ≥ 95%.
Pods Ready/Total
Ready pods against total pods
Baseline metric for capacity, and shows readiness against desired count at a glance.
Red: 0 ready.
Pods Not Ready
Count of pods in the fleet that are not reporting Ready.
Surfaces workloads that are running but not serving traffic.