Find the failed API calls behind broken pages with Browser Request errors
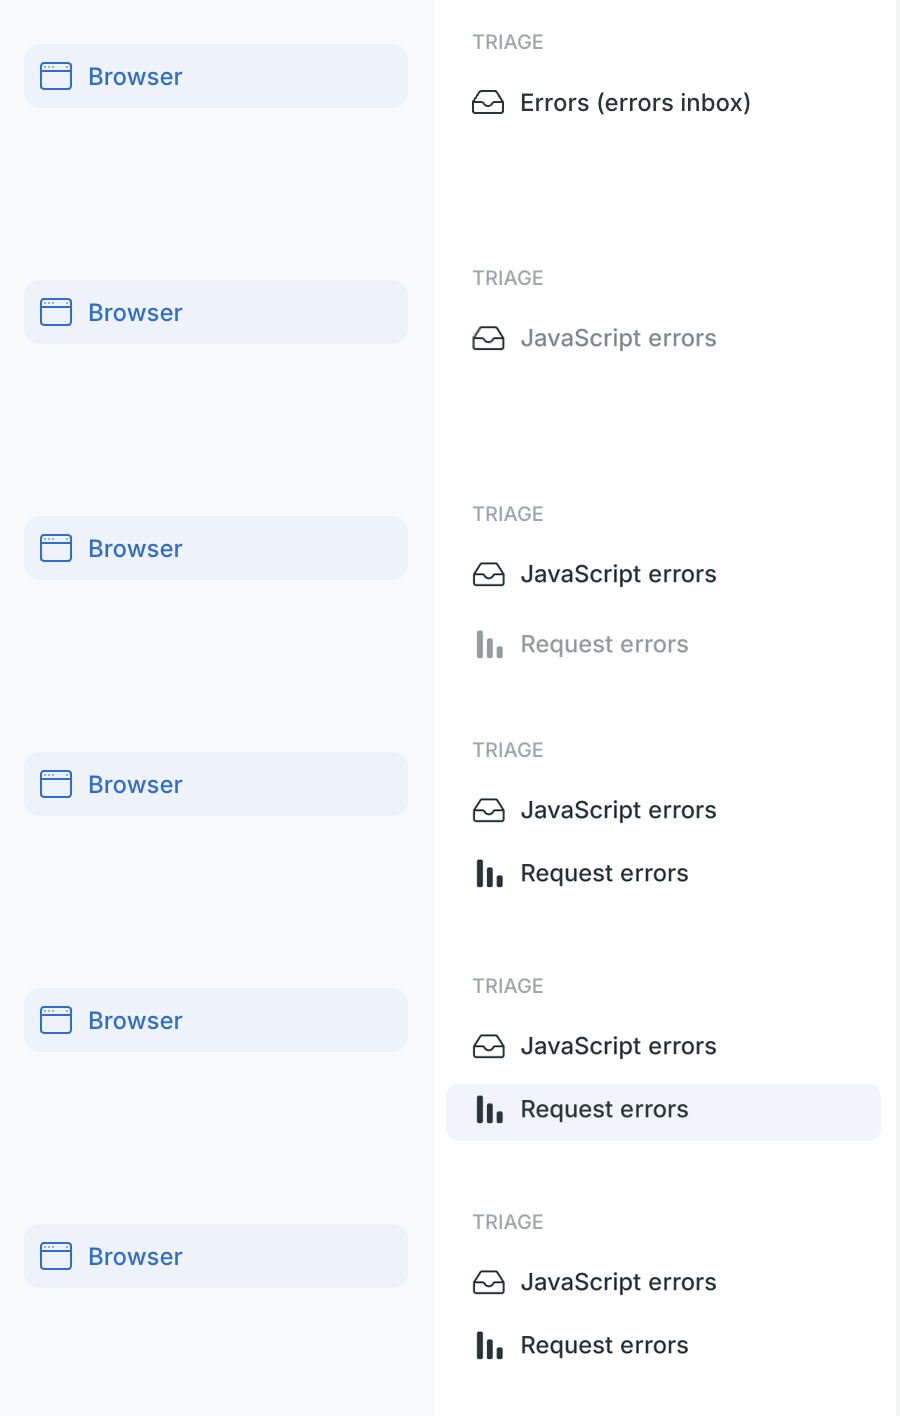
In your Browser application, a new 'Request errors' page groups AJAX and fetch requests that returned an HTTP 4xx or 5xx status code. You can see which backend or third-party calls are failing, how often, and where to start debugging.
'Errors Inbox' is also now 'JavaScript errors'. This is a rename only: your error groups, statuses, assignments, and comments are all still there. There's nothing to install or turn on, because 'Request errors' uses the AJAX data your Browser agent already collects. If you already use 'Request errors' for Mobile applications, this works the same way.
Get started
Head over to 'Request errors' in your Browser application to see which requests are failing, or open 'JavaScript errors' to pick up where you left off.